#pathtozerocarbon, #sustainability
16 – Beyond the Building: Landscape, Parking + Transportation
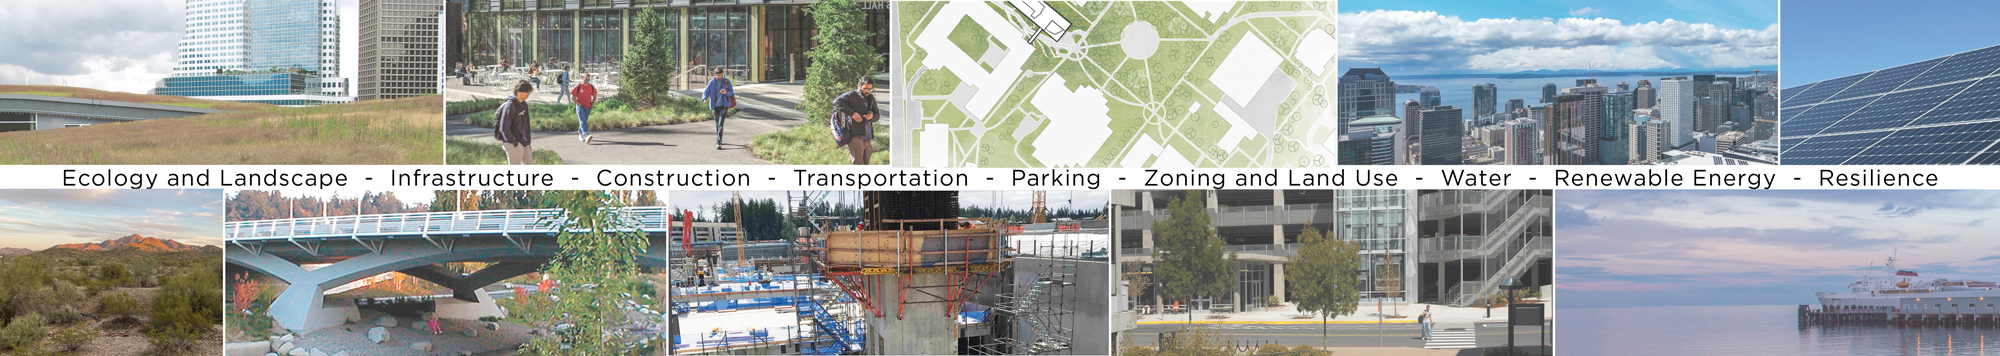
As the final post in the series, this is a catch-all for climate pollution implications resulting from a building’s physical and regulatory context: ecological systems, resilience, land use policies, land use for off-site renewable energy, transportation, construction, site landscape and hardscape, and more. Each of these provides a necessary context for a building to have a purpose. Each of these also needs urgent action to get toward zero emissions and address the carbon impact of our built environment’s design, construction and operation. Topics are roughly organized from most expansive (Ecosystems) to site-specific (Landscape).
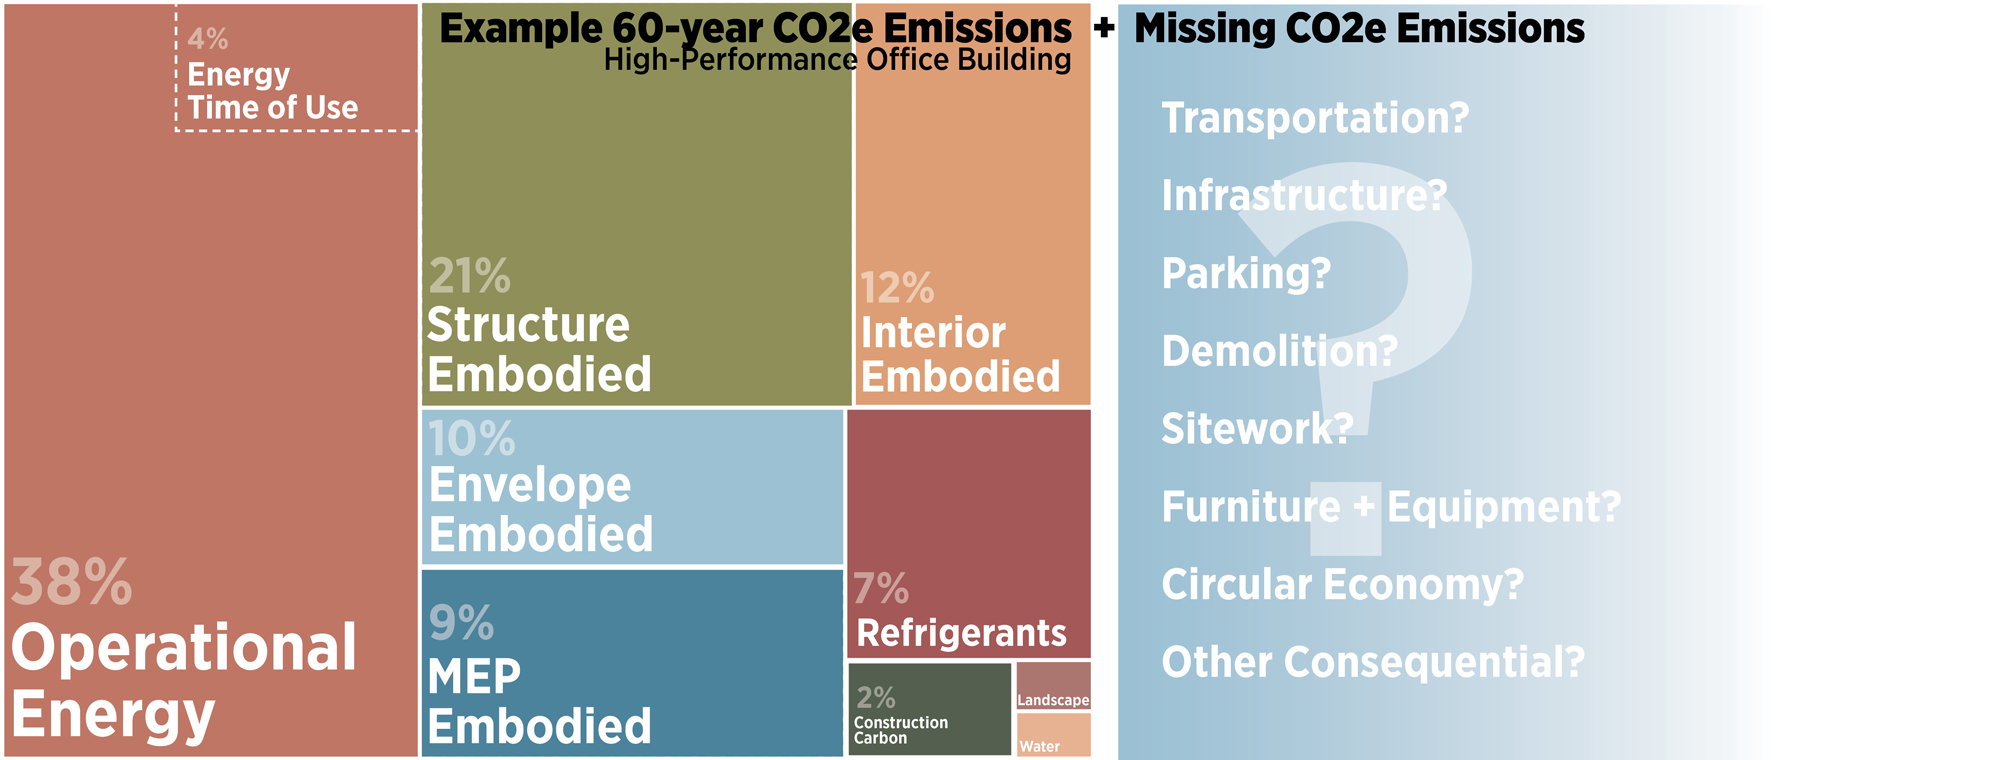
While we have some indication of the magnitude of many carbon pollution sources in buildings (chart on the left from Post 02), we don’t yet have the magnitude of many pollution sources on the right. This makes carbon neutrality claims premature.
Valuing Ecosystems
Human prosperity over the last several hundred years occurred within the context of clean air, healthy soils, relative climate stability, and innumerable other natural systems. Many of these natural systems are being degraded by carbon pollution and other forms of resource extraction and pollution. Humans have altered everything on the planet; there are no areas unaffected by pollution and climate change, including nature’s ability to remove and store carbon from the atmosphere. This damage is often downplayed as the cost of progress. The efforts that caused this pollution have raised a large percentage of the world’s human population out of poverty and radically increased human lifespans. Our successes, however, have significantly reduced the ecological functions we depend on for our most basic needs and emotional sense of wellbeing, complicating life for ourselves and future generations. Fortunately, we now have better technologies that can be ecologically restorative and climate neutral, providing a better life for us, our kids, and future generations of all species.
Valuing ecosystems can focus on immediate economics (what is the current market cost of fish, wheat, plywood, health care for pollution-induced asthma treatment, recovery from climate-change induced hurricanes, etc.) but it should also consider quality of life, long-term viability, and common values.
Valuing nature’s benefits in financial terms is an inherently flawed and biased exercise since natural systems are complex with interactive effects of which we are a part. Damage is not often immediately visible, and there is no realistic baseline where nature does not exist (until we destroy it). What is the cost of creating and purifying all air on earth, for example? In most costing models, nature’s indeterminate and widespread economic benefits are only viewed through narrow lenses of immediate and private costs, playing on our bias to focus on known and short term problems. (See Post 01 for estimates of the Social Cost of Carbon, one method of quantifying damage done by CO2e emissions.)
Attempting to value nature economically often distances us from and systematically undervalues nature’s necessity to humans; this line of reasoning is used to continue ecological destruction. Consider acid rain regulations, the ozone hole, human-created PM2.5 pollution, climate change and other human modifications of natural systems where action has been delayed to further short term economic and political interests by undervaluing the very real work of natural systems.
This is a ‘Tragedy of the commons’ problem, where we have better shared economic outcomes by maintaining our environment. However, each economic actor degrades a small portion of ‘nature’ as part of their business (burning fossil fuels, overfishing, using environmentally degrading supply chains, dumping waste, etc) and has no immediate financial interest in an ecologically restorative solution. However, all people and businesses do have a long term financial interest in preserving natural systems. The primary method of contributing to widespread maintenance of systems is through regulation and taxation, and our economic philosophy has been biased by industry against these collective actions, even when they are in our self-interest. Some have tried to value nature’s contribution to our economies, suggesting nature contributes 2x the entire global economy each year. A different approach is adding up all of the costs of degraded ecosystems. These estimates are helpful if not definite, and suggest that the cost of not degrading ecosystems is less than the cost of degrading them, all things considered.
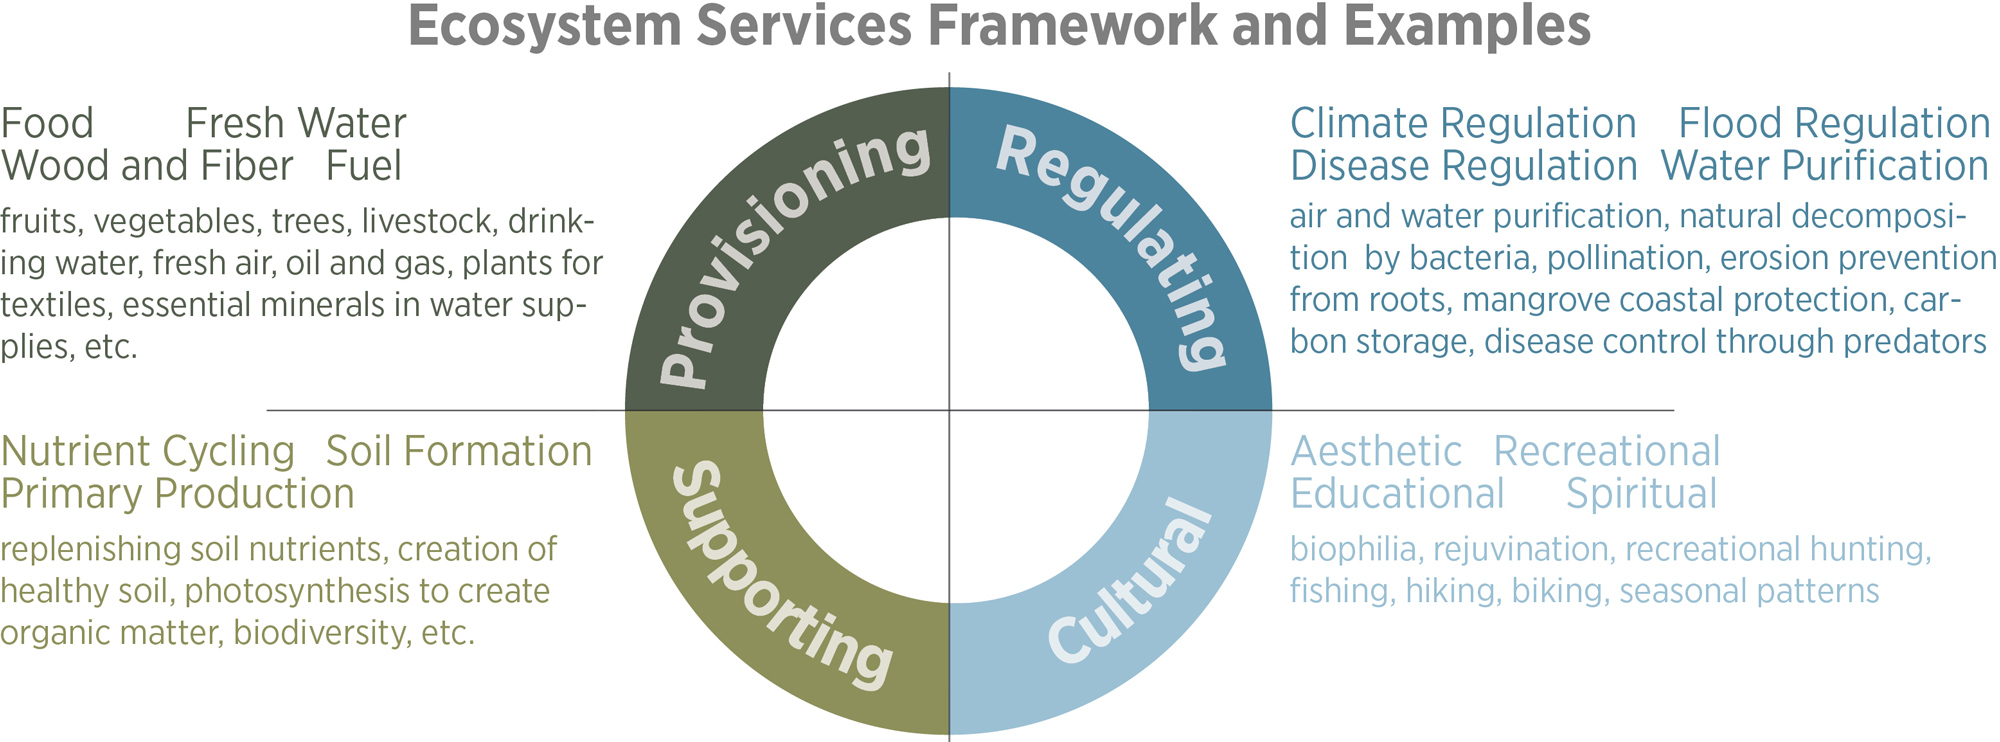
An ecosystem services framework (used in the Millenium Ecosystem Assessment) highlights examples of essential natural systems that support human life and wellbeing. Many human activities currently degrade these systems, especially carbon pollution and climate change. These are priceless systems.
Longevity and Resilience: Technological, Social, and Economic
Longevity is a long-term emissions-reduction strategy, and longevity would seem to be one indicator of resilience when we look backwards. Projecting longevity forward is more challenging since many buildings are torn down before their functional life is over, most often for reasons unrelated to initial design choices, but useful when we think about designing buildings for 200 years of useful life.
While we like to talk about 100- or 200-year buildings, there is no commonly understood description of a building planned for long life. A description might include physical resistance to regional shocks and stressors, the ability to function with little or no power, long-lasting systems that are waterproof and structurally adequate, flexibility to adapt use to current needs, enough character to evoke a community desire to save it, and economic and social resilience to support continued use over centuries of change. The definition might also include the ability to be deconstructed, recycled or composted in case the building’s purpose or contexts change significantly, with components retaining economic value as building blocks for the next projects, see Posts 09 and 10.
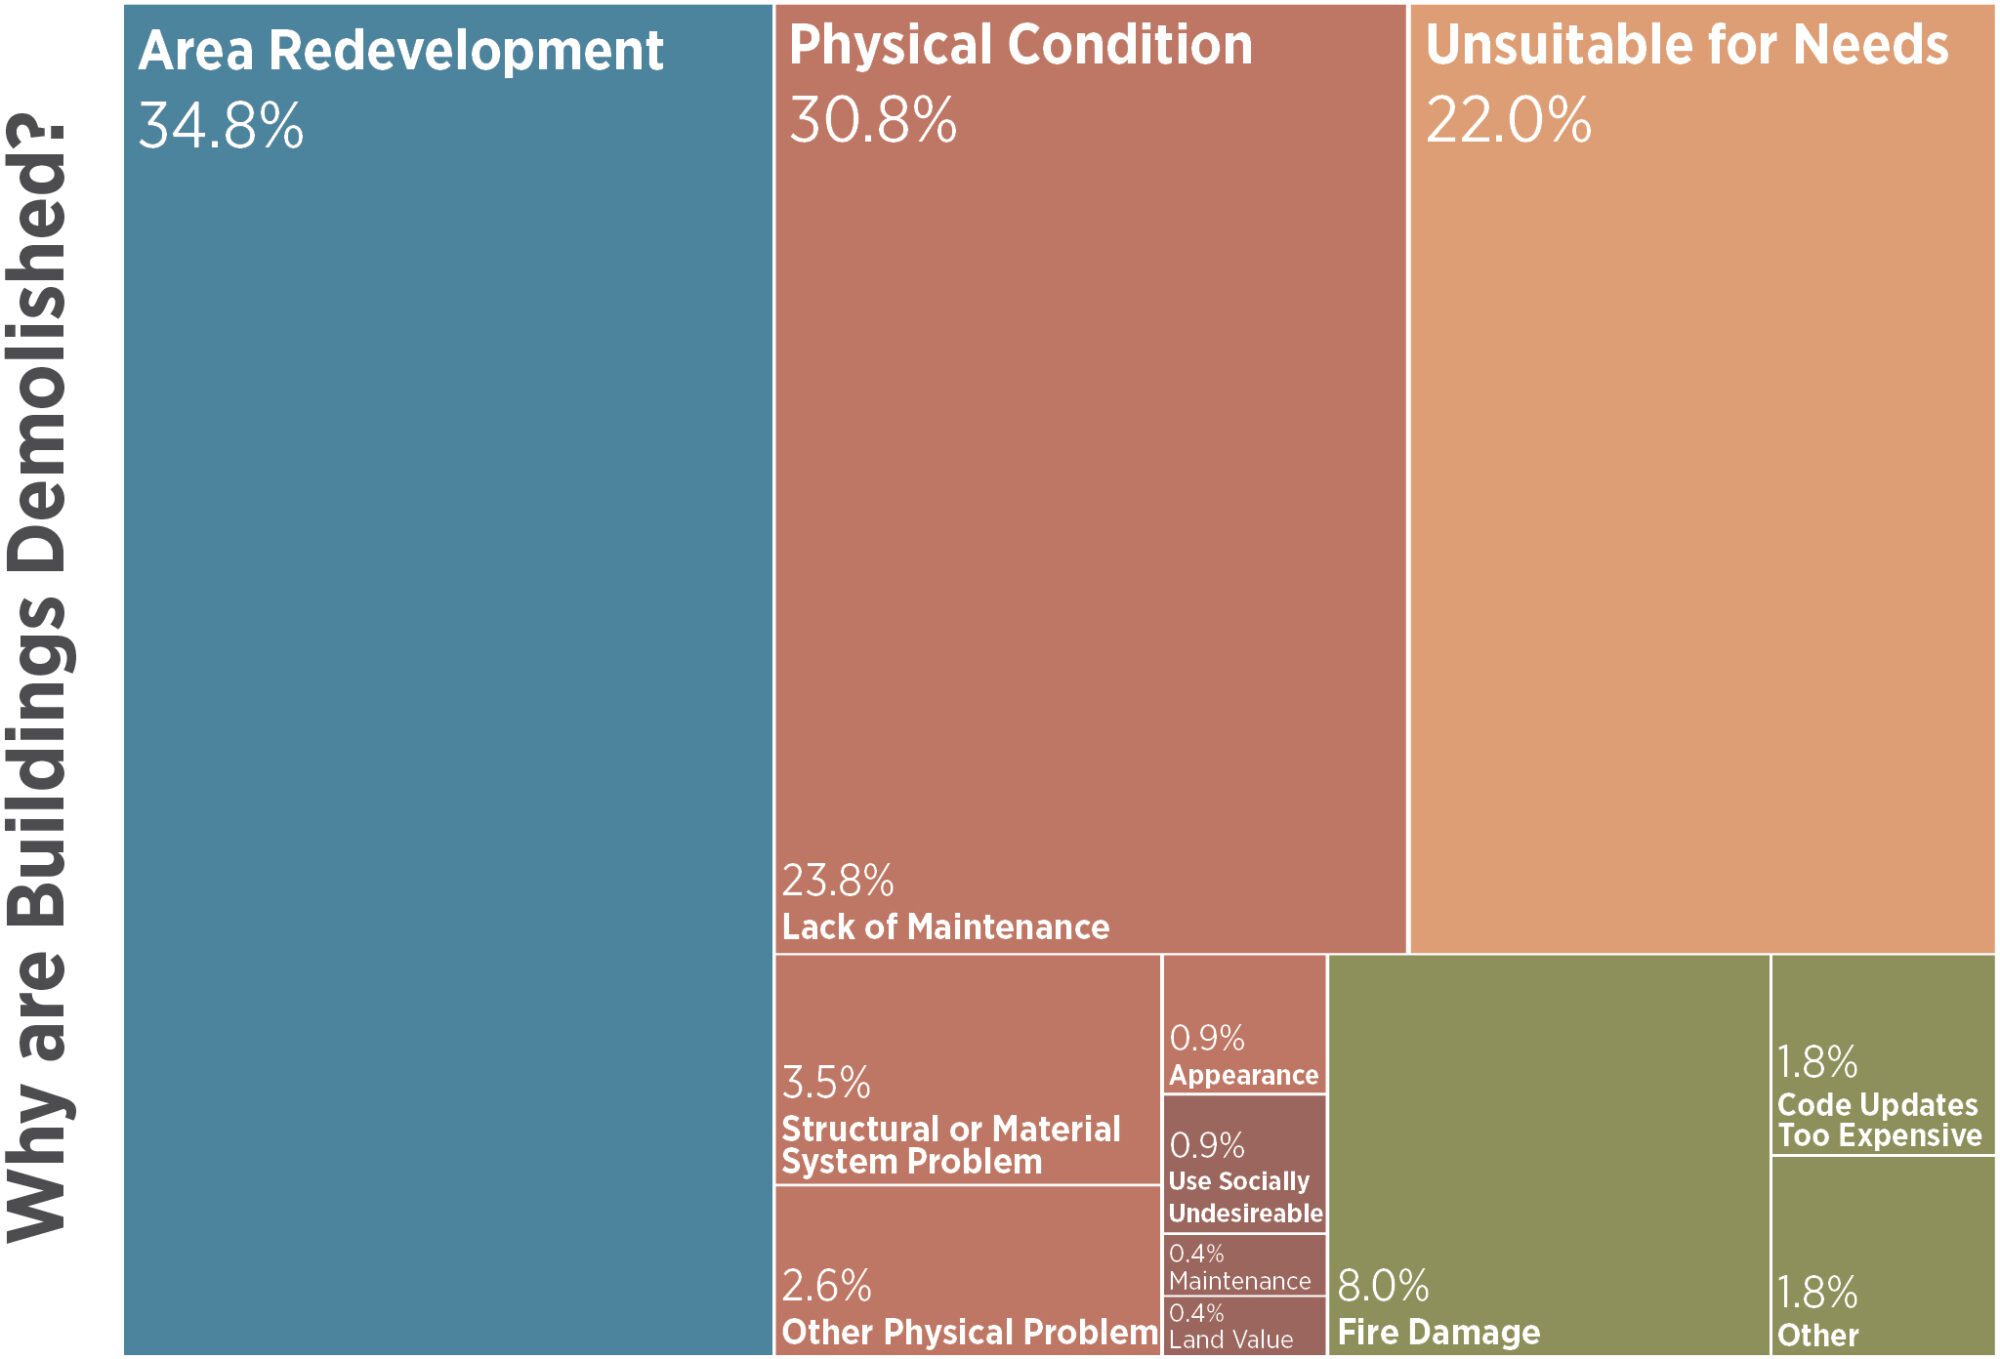
A 2004 study of demolition across 227 buildings provides insights into building longevity characteristics; while a single reason is identified, it is likely that multiple factors contributed to each demolition. Disasters, including those made worse by climate change, are a significant fraction of demolition in some areas.
Building and site resilience cannot be separated from social and economic resilience. Buildings are loved and maintained only in certain social and economic contexts, and building design can help support these contexts. Ghost towns of the American West, closed malls across the US, parts of some Midwest cities, and other areas contain examples of buildings that may have had a 200-year lifespan except for their social and economic context. The earlier post on existing buildings and reuse expands on this topic.
Shocks and stressors that test resilience are numerous; few people imagined a pandemic would shutter businesses and change the work world as it did in 2020. While most building owners are concerned about resilience at the buildings scale, resilience is best understood and planned for at a larger scale: example threats include flooding, loss of critical bridges and transport networks, change in local economic opportunities, sea level rise, or a fresh water shortage.
For this reason, cities and neighborhoods are often the most appropriate scale for resilience planning. Buildings may be understood as constituents of their locale, each adopting strategies for resilience that contribute to a larger network at the neighborhood, city, and regional scales. While there is no universal framework for all aspects of resilience, some guides provide clues about critical elements:
- LEED Assessment and Planning for Resilience pilot credit
- Second Nature Resilience Planning
- Many cities have resilience frameworks – AIA Resilience Design Toolkit, AIA ROI guide for resilient design and AIA Resilient Project Process Guide
- FEMA National Risk Index Map
- Climate Mapping for Resilience and Adaptation Tool
- The Climate Explorer
- Risk Factor
- Climate Risk + Resilience Portal
- Probable Futures
- Cal-Adapt (California)
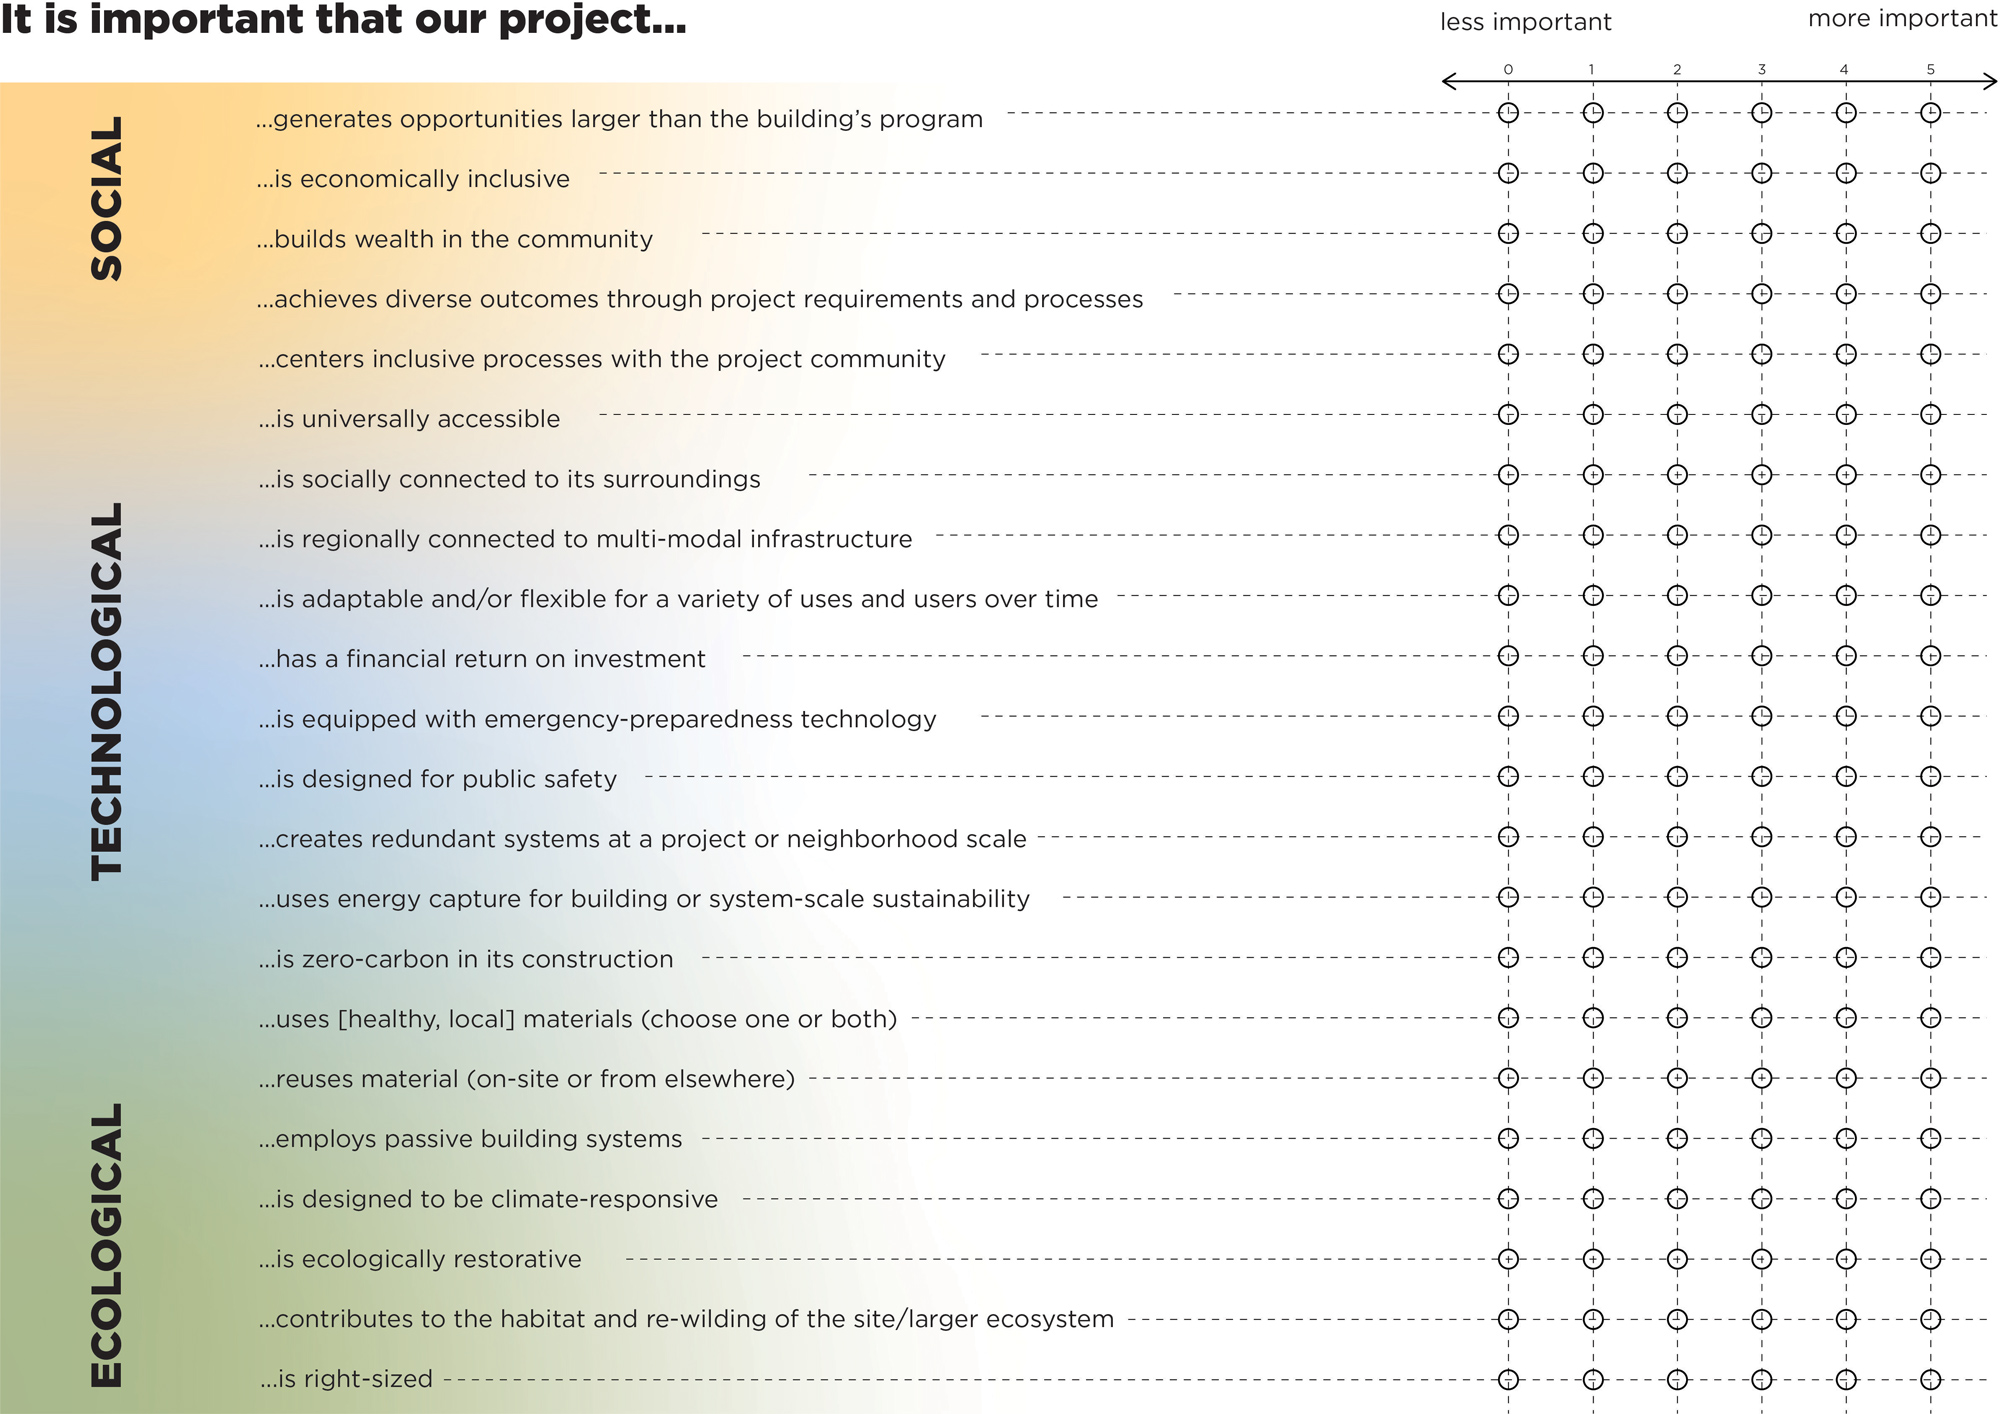
A survey can help project teams understand their resilience priorities.
Land Use + Carbon
Carbon accounting sometimes excludes a category called Food, Agriculture, and Land Use (FALU), although it is roughly 25% of total carbon emissions as noted in Post 04. This is a broad category that includes agricultural practices, deforestation and afforestation, and emissions from changes of land use as greenhouse gases stored in the earth are sequestered or emitted. As a set of natural systems, FALU emits and reabsorbs carbon each year (which is why the Keeling curve bounces up and down annually). Historically FALU has been roughly carbon neutral annually, which is why it is sometimes excluded. It is now a net emitter globally due to deforestation, changes in agriculture and livestock, and some early effects of climate change. Agriculture emits about 11% of US greenhouse gases (GHG), while our land currently sequesters an equivalent of 12% of US GHGs, making it a small net carbon sink. Drawing boundaries however, is not helpful since US lifestyles result in deforestation and land use changes elsewhere that are responsible for net carbon emissions while we preserve our own forests.
Urban Land Use + Carbon
Beyond direct emissions, the regulated use of land in urban and suburban areas directly impacts many sources of carbon pollution, and is a key strategy in any solution: transportation, building and lot size, retained wildland, infrastructure (roads, sewers, water, and power) and more. Land use zoning – such as limiting land to single family housing only – that caps density and mandates suburban sprawl has a significant increase on household carbon pollution well. High-rise buildings generally use more energy than low-rise buildings, though they decrease infrastructure embodied carbon.
As mentioned in Post 11, large cantilevers, transfers, and stepbacks increases embodied carbon (per unit area), sometimes these are a result of form-based zoning, as shown in this Toronto study. Form-based zoning has an effect on carbon in two other ways: often below-grade spaces are exempt, increasing likelihood of additional below grade area that increases excavation, shoring, and concrete construction; and it limits the height of buildings, lowering total floor area built and increasing the relative impact of foundations and transfers. Height-based zoning can also result in lower floor to floor height, lessening the chance that a building can be repurposed later.
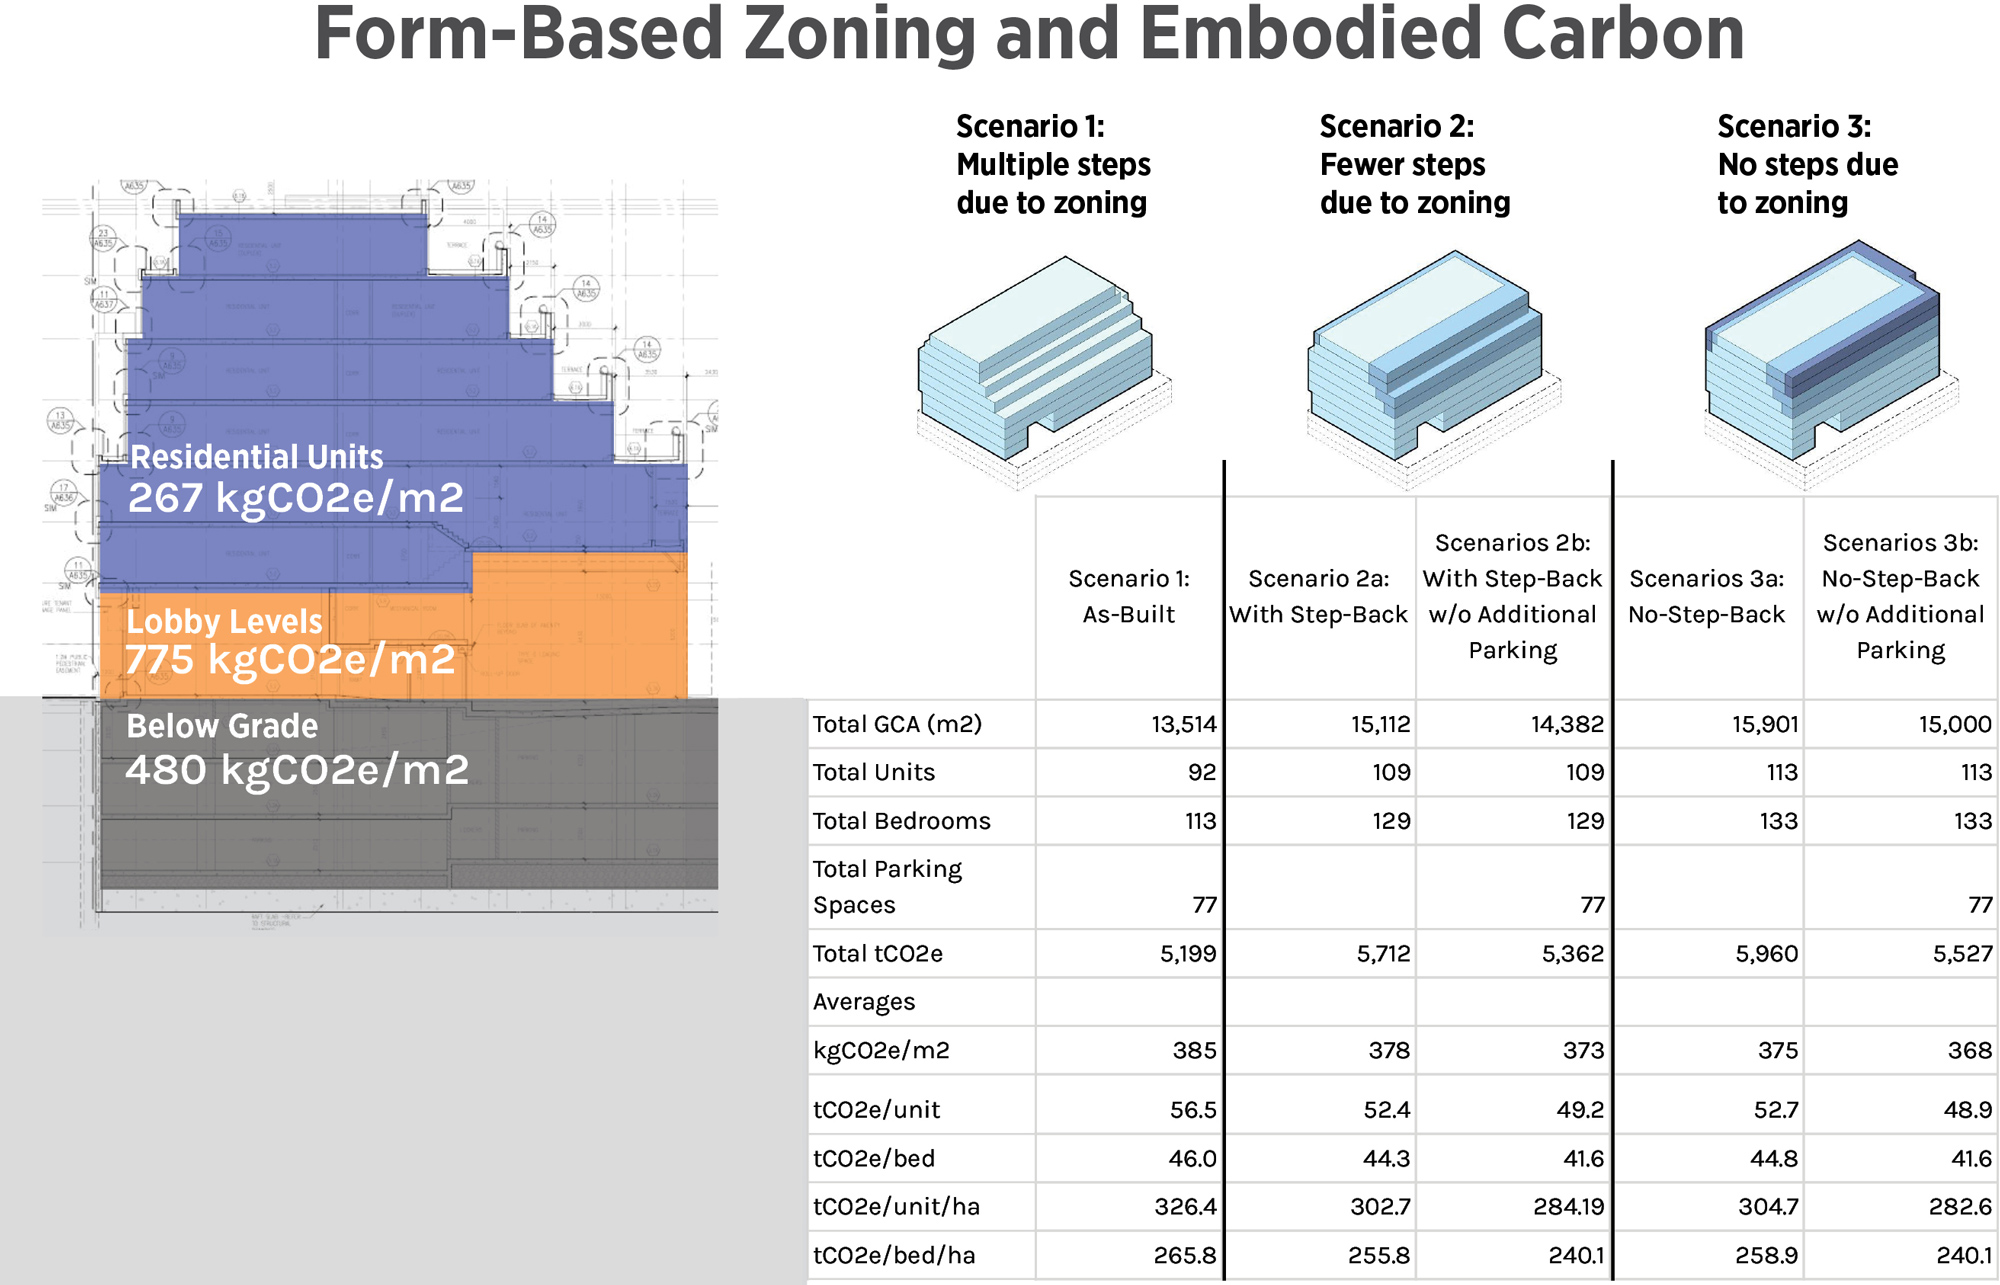
This Toronto study suggests that form-based zoning – angled setbacks in this case – increases embodied carbon per unit and per usable floor area based on three scenarios. Scenarios 2 and 3 are also shown in the table with and without parking. Sectionally, the lobby areas are highest in embodied carbon due to a transfer slab between the parking garage structural grid and the residential structural grid, while the parking area below ground to store cars is also a significant contributor to total embodied carbon.
At a site level, building on poor soils, for instance, can radically increase the size of the foundation (think hundreds of concrete piles beneath a three-story building), building in mudslide, steep, or on poor soils can reduce resilience as buildings may be unusable after an event, wasting embodied carbon.
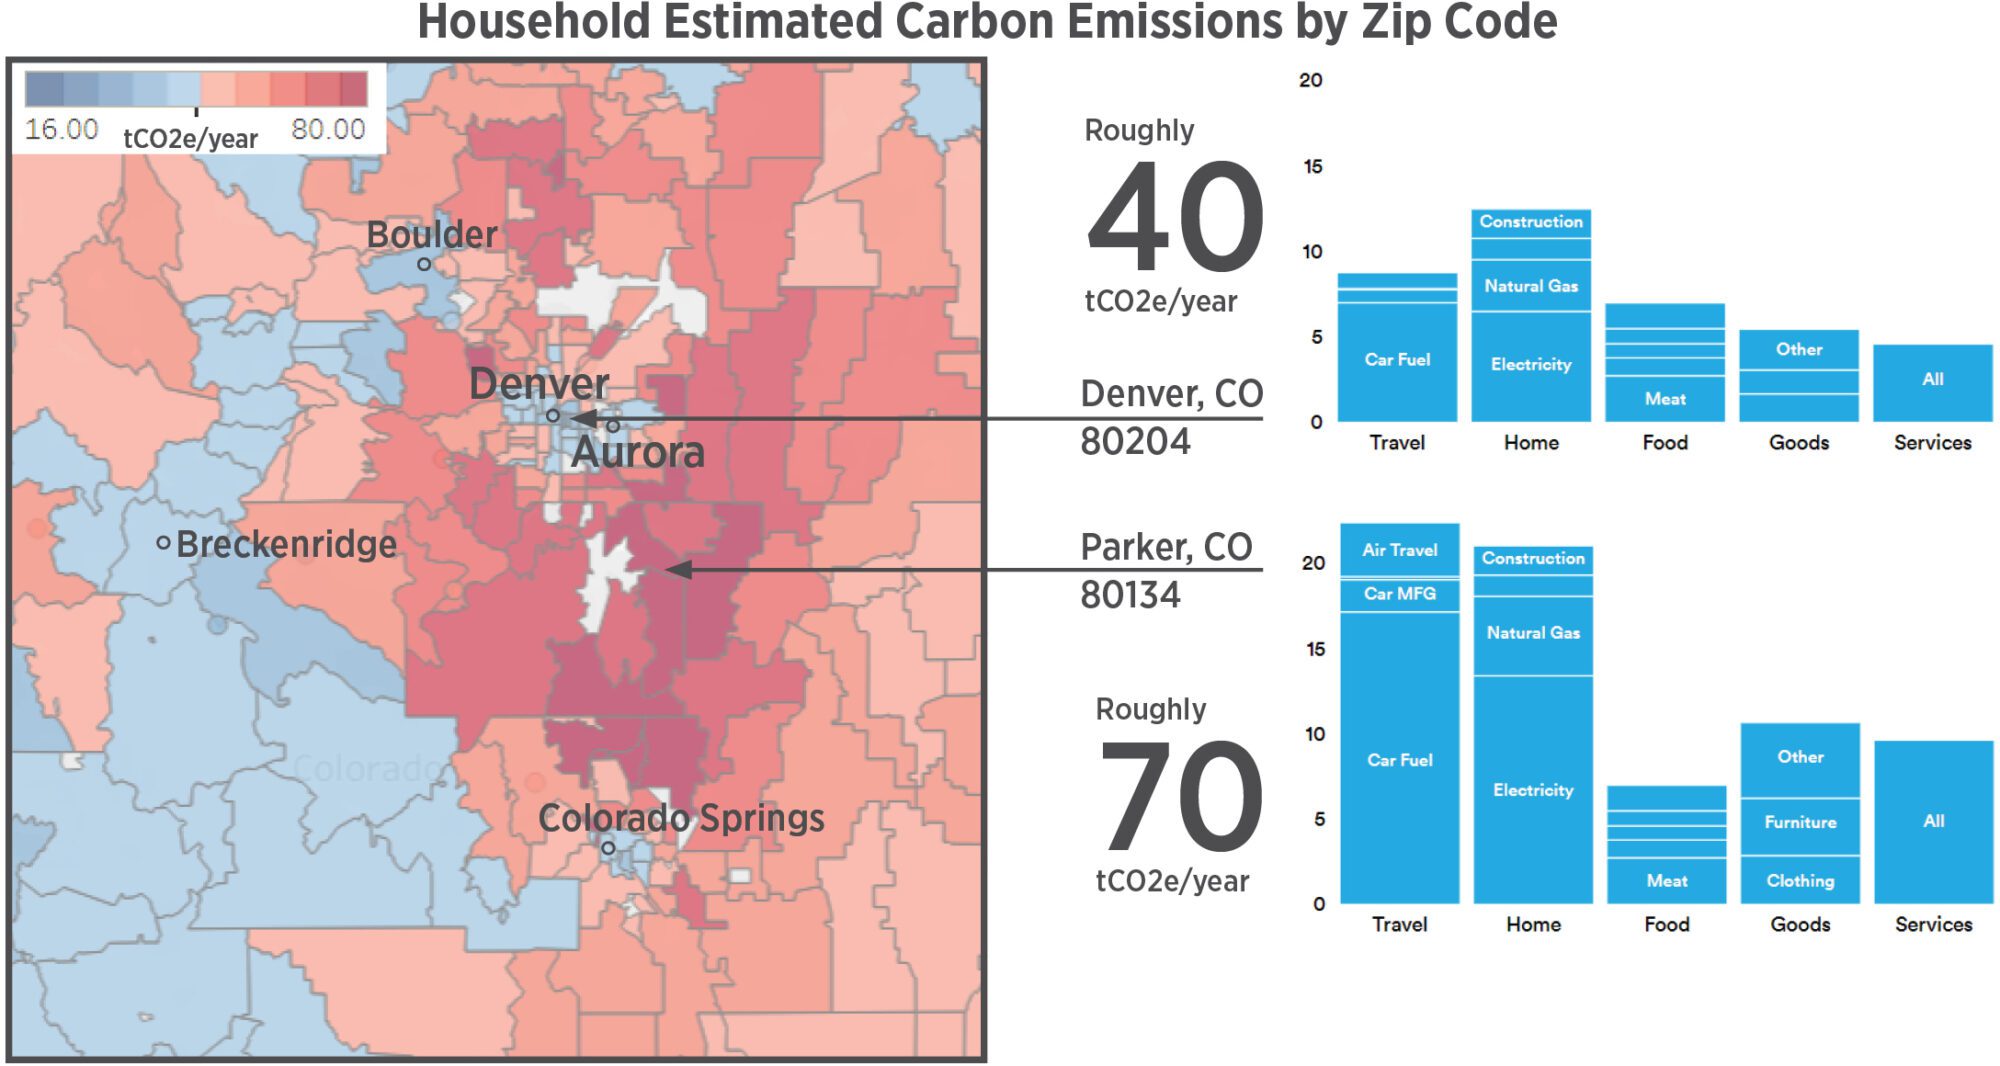
The Berkeley CoolClimate map is based on research that suggests that urban and rural areas have lower carbon footprints than suburban areas. The underlying data suggests that increased income is also associated with increased emissions. A zip code’s approximate emissions breakdown can be found on the related CoolClimate calculator, though they don’t match the map exactly. The research is based on surveys are includes a wide variety of household emission types.
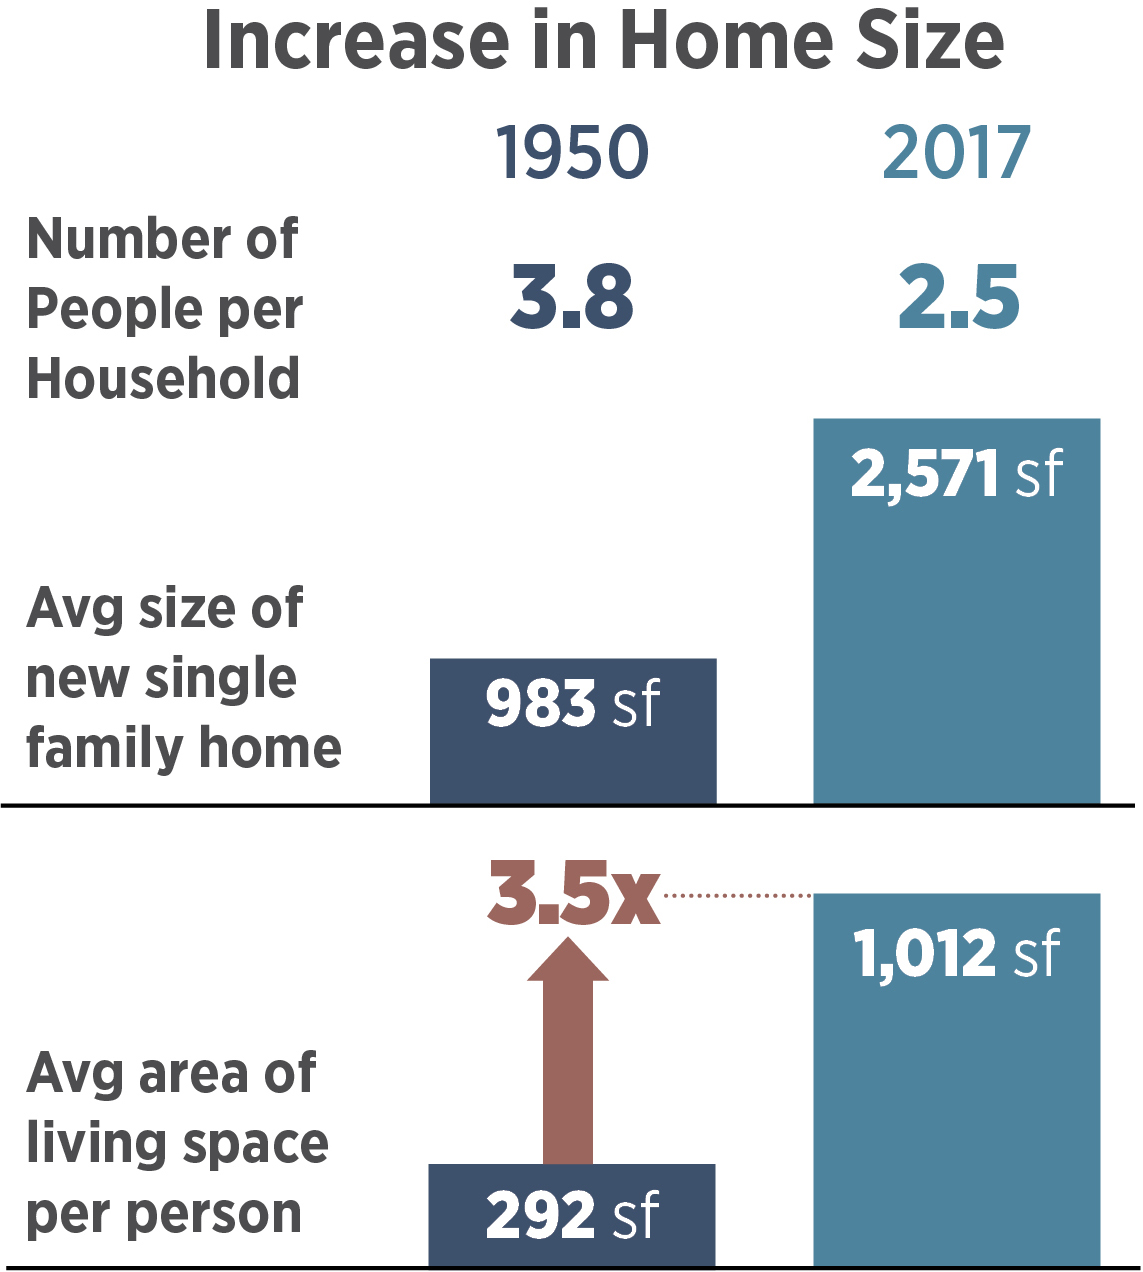
Carbon emissions and home prices have risen dramatically as home sizes and space per person has grown 3.5x over the last 70 years. Source: AARP The ABCs of ADUs.
Over the last 70 years, homes have nearly tripled in size, while accommodating fewer people. This has had disastrous effects on affordability, per person energy use, and embodied carbon. If the average household embodied carbon is 35 kg/sf, this means the embodied carbon share per person for housing has gone up by 350% over the last 70 years. To some extent this is a result of single family zoning, since the only improvement a homeowner or developer can do is to increase the size of a home.
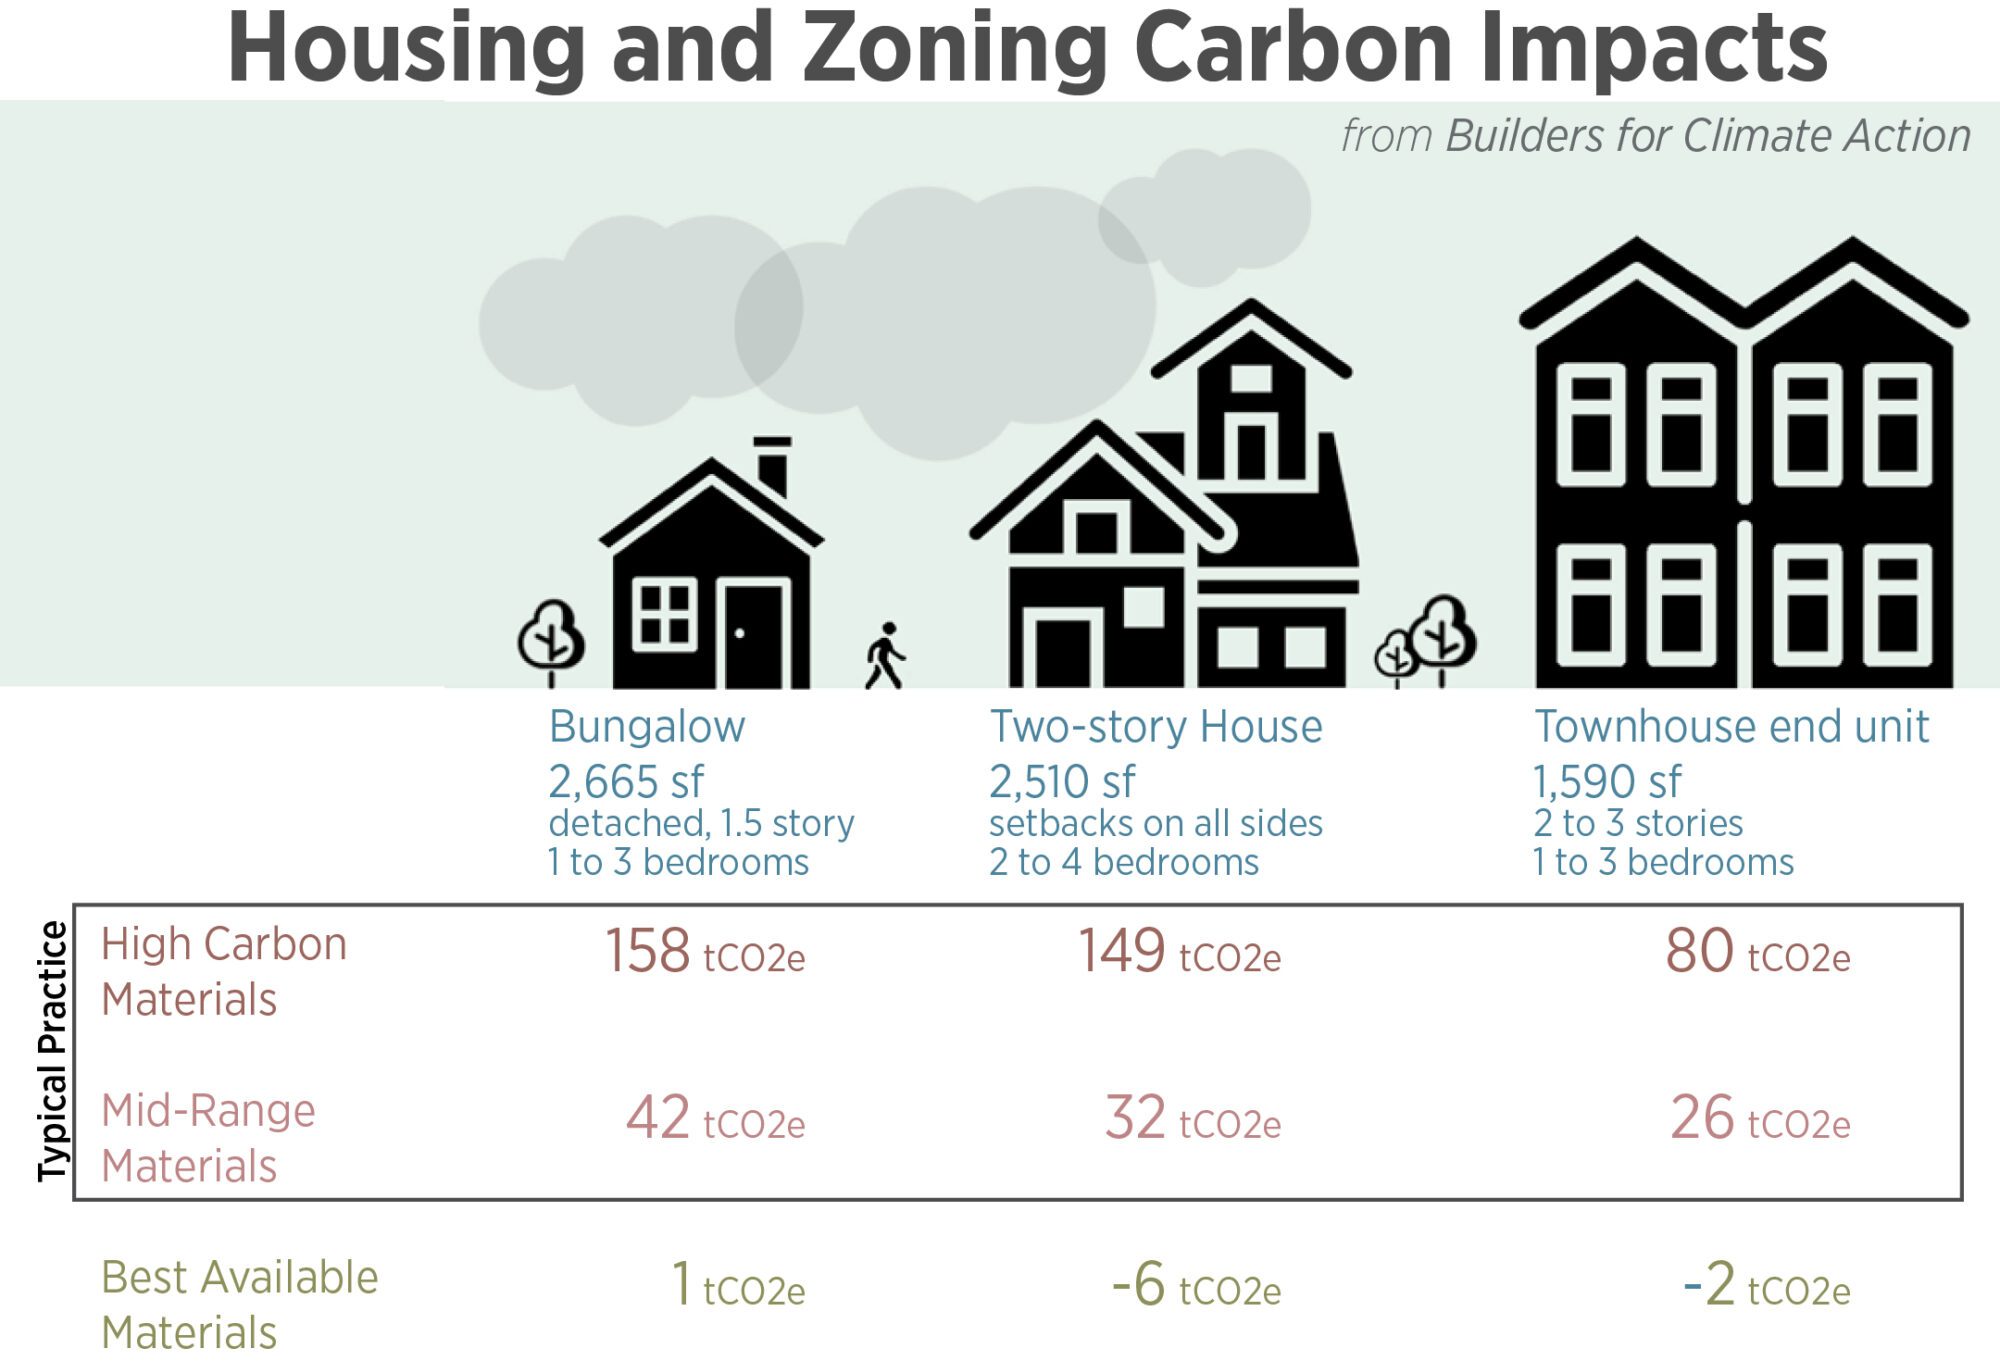
Since the advent of the car, zoning strategies have frequently limited housing types to only single-family, detached dwellings. This has negative impacts on affordability, carbon pollution, and more. Detached housing also increases the roadway size and thus carbon pollution since homes are farther apart. A study by Builders for Climate Action suggests that with low-carbon and carbon-sequestering materials, homes can be designed and built to be net carbon sequestering.
Land Use and the Renewable Energy Transition
The renewable energy transition will require a significant amount of land use for solar and wind generation. While fossil fuel plants can be built near energy use centers with fuels transported to them, solar and wind plants are built where climate resources are optimal, with the generated energy transported to the power use centers.
Energy efficiency, avoiding peak loads, and on-site energy generation and storage are the keys to minimizing the cost and land use impact of the renewable energy transition. Every megawatt (MW) saved at peak electricity usage times roughly translates to 5-10 less acres of land needed in a solar-rich area; 1 MW is the approximate peak load for an all-electric 10-story office building or 50 all-electric homes. As mentioned throughout this series, the embodied carbon of renewable energy that supplies a building’s needs should be considered as part of any net-zero claim.
While residential rooftop solar has higher direct costs (under $3/watt) per installed kilowatt (kW) than utility-scale solar (just over $1/watt), rooftop solar reduces the need for renewable energy land use, transmission (which can take a decade to permit and build), provides site resilience, and has economic benefits for the owner. This means that rooftop solar can be more cost-effective than utility scale solar in many instances. Rooftop solar has a few challenges: 1) Utilities in the US often earn a guaranteed return for investments in power generation, so in some cases they have a profit motive to disincentivize rooftop solar 2) in states with net metering laws, utilities sometimes have to pay higher rates to buy rooftop solar than they’d pay for power on the wholesale market and 3) energy generation from rooftop solar (and storage from onsite of batteries) is often behind the customer meter, meaning it is counted as efficiency from a utility perspective, not energy generation or storage. This will change as utilities implement demand management to relieve peak loads.
What footprint do we need to build out the renewable energy transition? Wind has a very small physical footprint (pads and maintenance access) but a large visual footprint since towers may be half a mile apart. Solar has a large physical footprint, but can maintain or improve ecological function in some cases. Co-locating renewable energy with agriculture, avoiding critical habitat, planning to maximize use of solar and wind resources, and extensive new transmission lines to connect these areas with urban and industrial centers can all reduce the land impacts. Enhanced geothermal power plants, an emerging technology, could also significantly reduce land use impacts. Since we know where the highest value resources, we need interstate, multi-utility transmission plans to connect to these areas.
- The Bureau of Land Management has a draft update that includes 35,000 square miles of federal land for solar development (based on NREL estimate of national energy needs), which is much less federal land area than is currently leased for oil and gas in the US (125,000 square miles) and a small subset of all federal lands.
- Another report suggests the land and visual footprint for renewable energy will be around 100,000-400,000 square miles.
A Nature Conservancy study suggests a baseline case of perhaps 125,000 square miles with advanced energy efficiency, rooftop solar, and good land use planning.
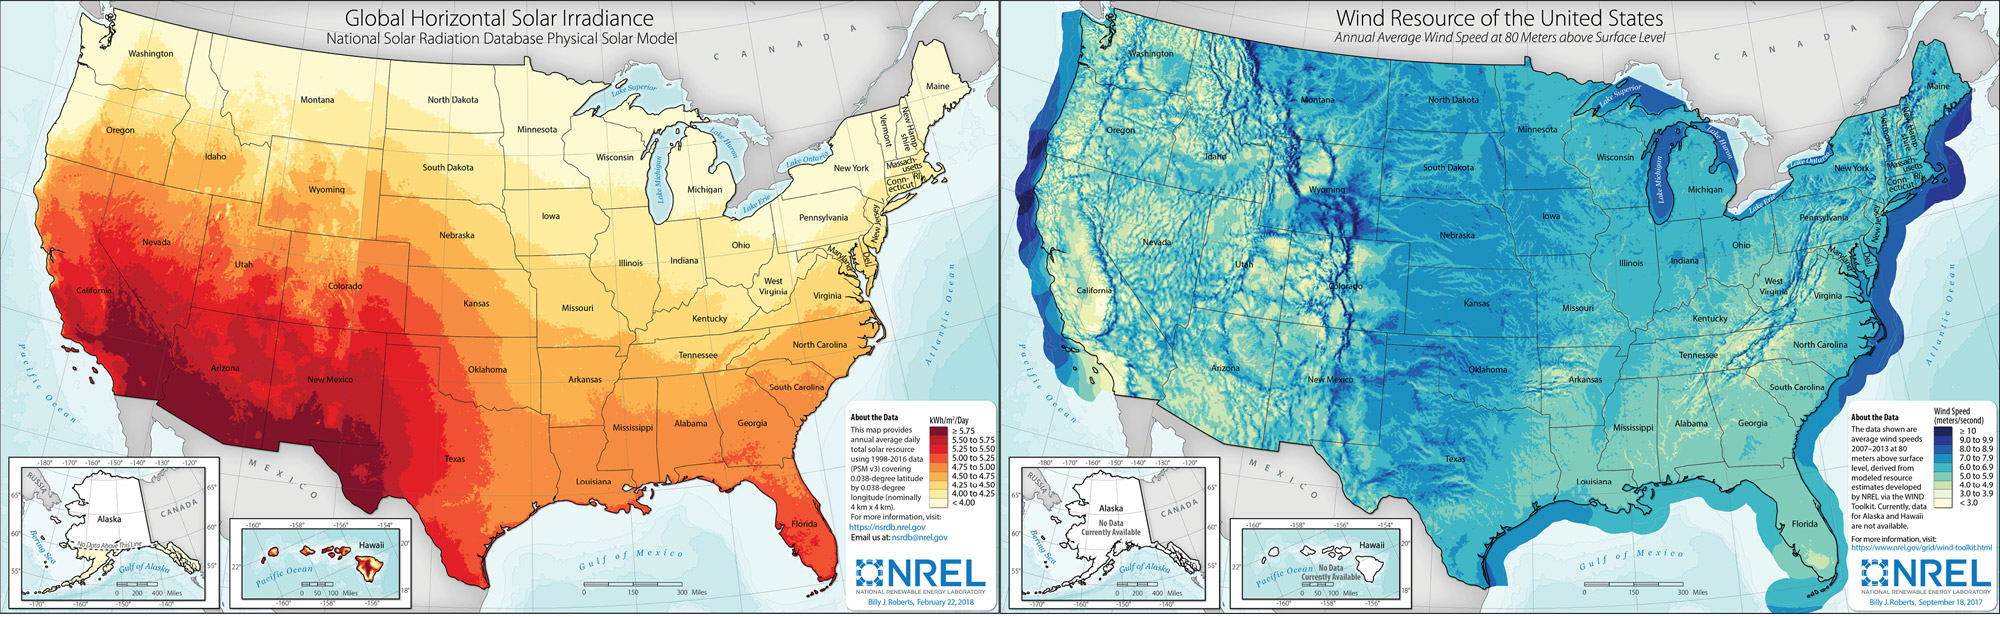
Maps showing NREL solar and wind (at 80m height, on and off shore) resources in the US. New renewable electricity generation from these two resources require the most land use planning and are likely to be located in high resource areas. Connecting these areas to industrial and city centers and to each other for resilience will require new transmission infrastructure.
Transportation: Location, EVs and Zoning
The transition to electric vehicles (currently around 18% of global new vehicle sales) will reduce tailpipe emissions over the next 30 years, but equity issues and other carbon emissions will remain. Site selection, land use and policies determine whether building occupants have transportation choices that reduce climate pollution and dependence on automobiles. While we love net-zero energy homes and wildlife centers within nature, the transportation and transportation infrastructure emissions associated with these are often horrendous.
‘Tailpipe’ emissions (such as EPA estimates) – pollutants measured from the tailpipe of combustion engines – are often cited as vehicles’ total emissions. This excludes the production and distribution of fuels (called well to pump emissions), which add roughly 30% to the tailpipe emissions. Other emissions are from the construction of roads and the embodied carbon of the vehicle itself. Carbon neutral claims should include estimates for all of these. Both LEED Zero Carbon and the ZeroGuide methods include the embodied carbon of infrastructure and vehicles in their calcs as well as the emissions from the extraction and processing of fuels.
Increased density – usually a factor of zoning laws – generally increases transportation choices and reduces transportation emissions as well as construction and maintenance costs for infrastructure. Buses and trains are suited to serve denser populations and reduce peak ride times. Combining a minimum density with transportation planning can also encourage walkability and bike ability, improving physical health and reducing air pollution. A variety of new personal electric mobility options take up less space as well.
Planning strategies include Transit-oriented development (zoning for density near mass transit hubs), smart growth, and new urbanism. Parallel efforts like Strong Towns focus on transportation, housing affordability and increased density that allows transportation options. Beyond zoning, California suggests 3 ways to reduce transportation carbon emissions: Zero-emissions vehicles and infrastructure, human-powered vehicles, and mass transit. The American Planning Association also has guidance for sustainable multimodal planning.
Nearly half of global shipping is for fossil fuels (oil, gas, coal), so reducing dependence on fossil fuel-based transportation means that we will cut shipping and shipping fuel use drastically. While some additional wind, solar and battery components will be shipped, the gross weight and bulk of these items is significantly less than that of fuels.
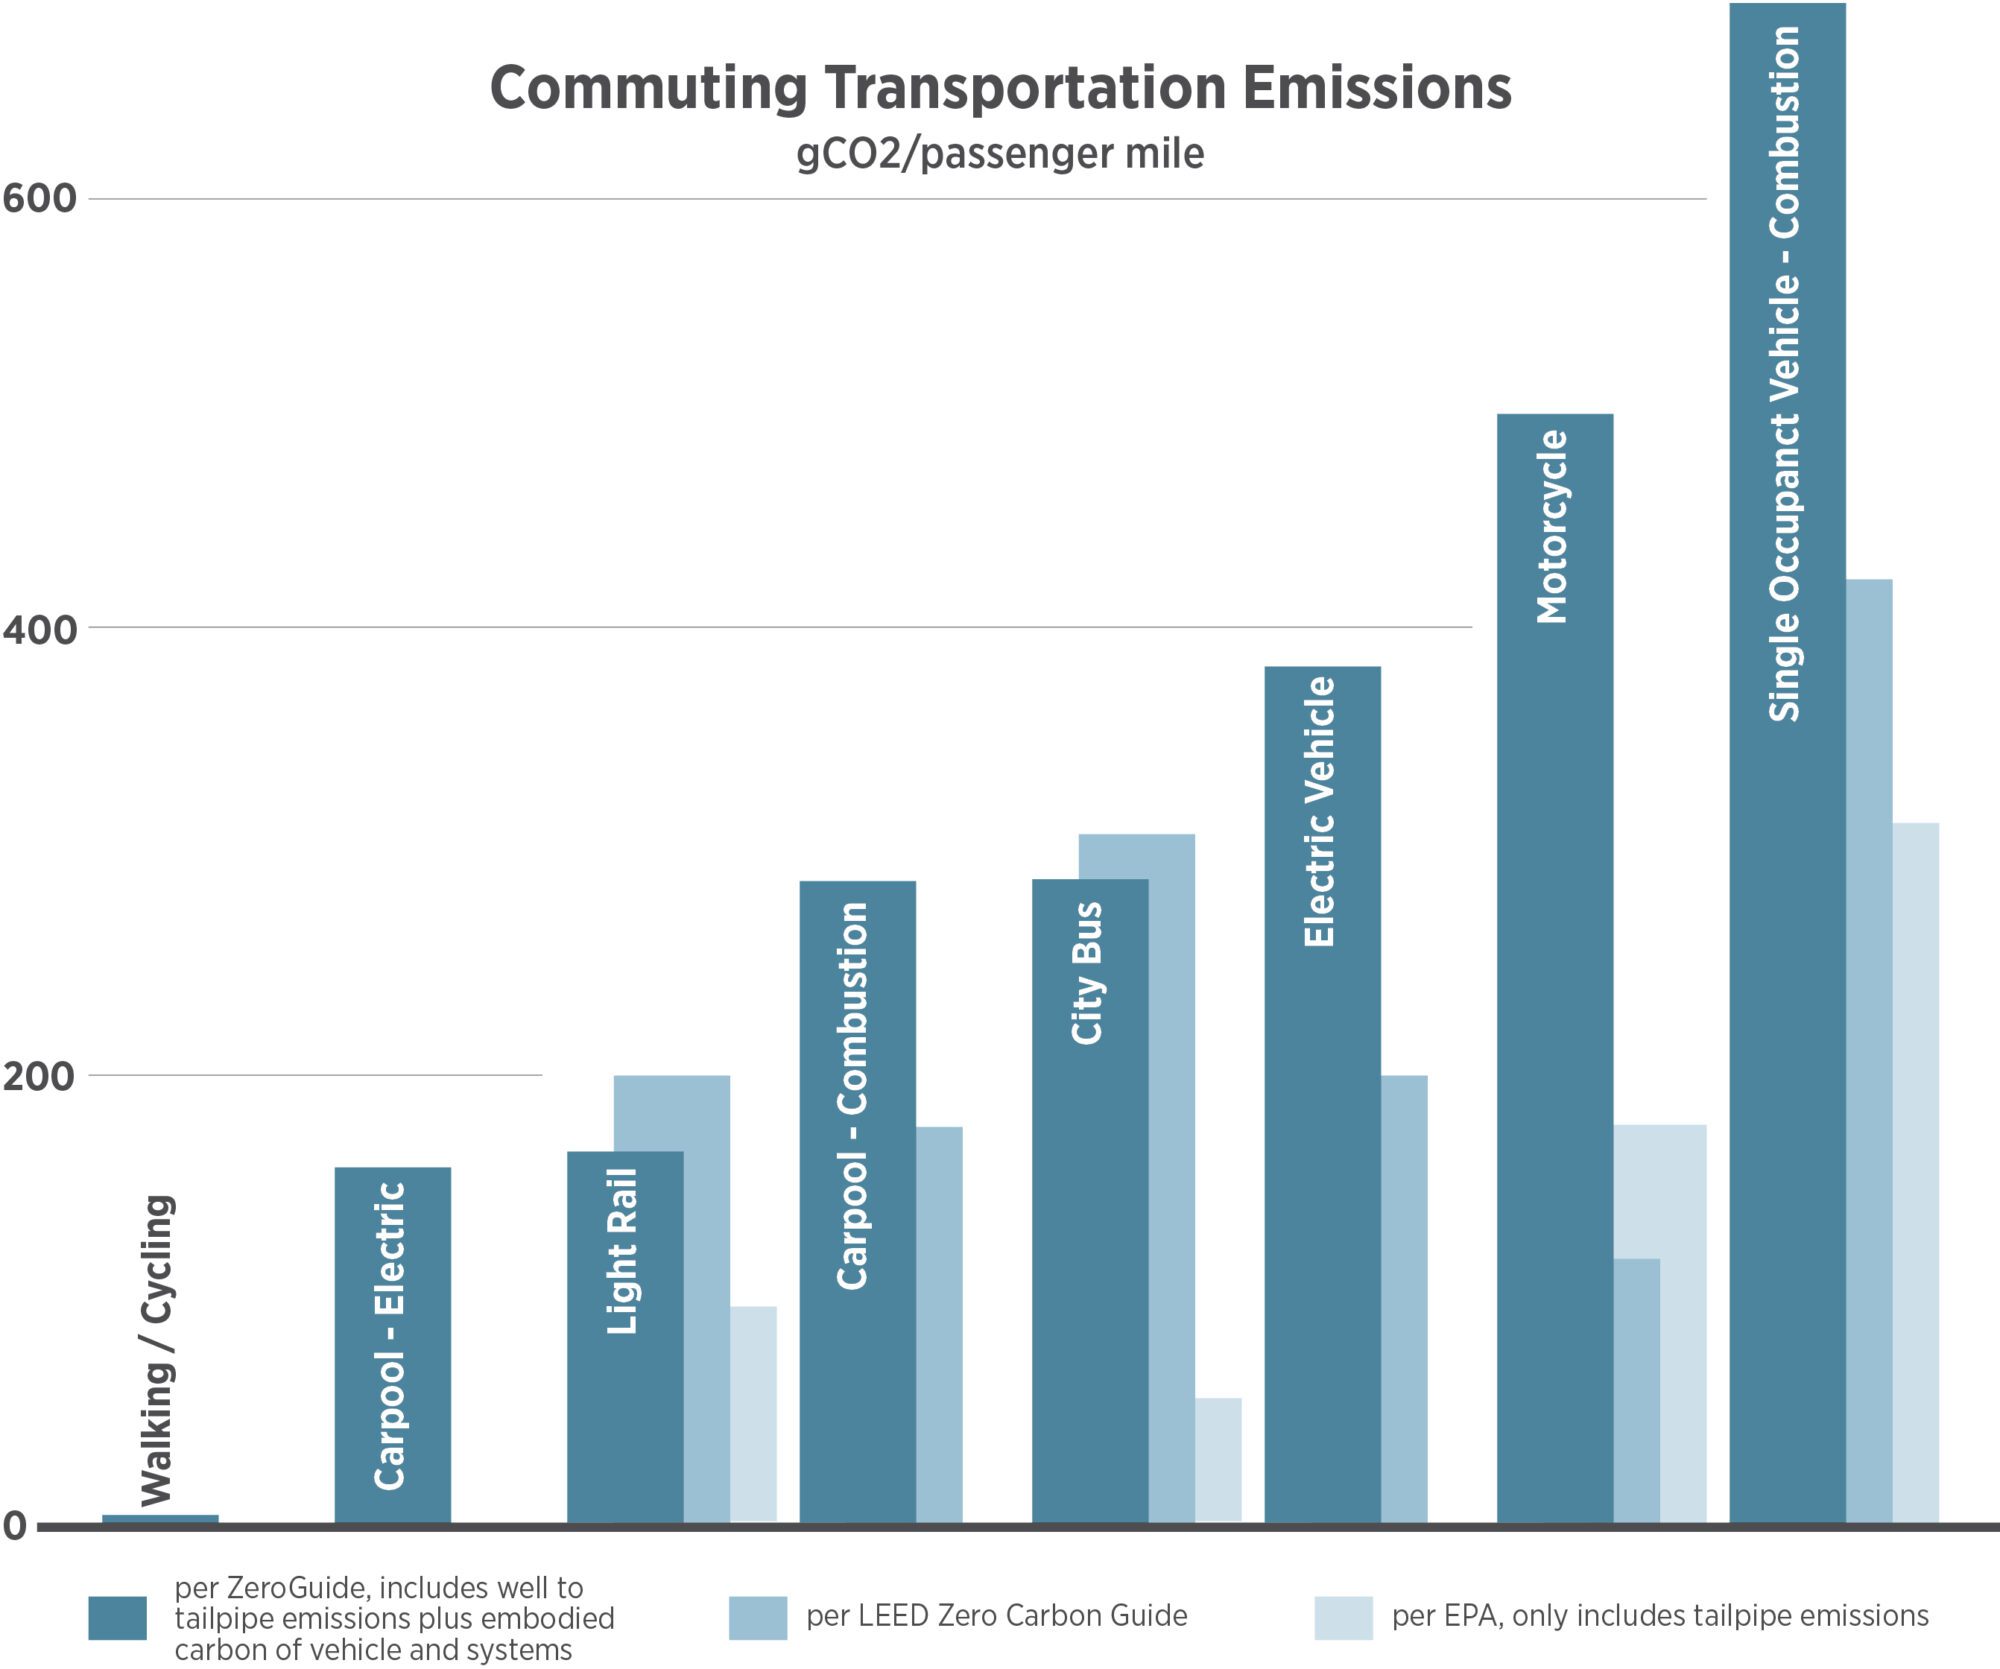
Personal transportation carbon calculations are often based on total miles multiplied by emissions factors per passenger mile such as these from the Zero Guide (most comprehensive), LEED Zero Carbon, and the EPA (which only include tailpipe emissions). For freight, transportation is often calculated based on these factors.
There is No Free Parking
Modern society, with lobbying from powerful interest groups, is largely automobile dependent, allocating huge land areas and taxes for roads, highways, and parking spaces. This has made other transportation modes more challenging and less safe, especially as car sizes have grown.
The US has built 3-8 times more parking stalls than vehicles, which are often mandated by zoning code. This significantly increases the cost of housing and services and is an indirect subsidy to the auto and gas industries. We have wide streets to accommodate cars driving and parking instead of much smaller streets with more greenery and social opportunities that would be required for walking and biking.
Parking garages are nearly always constructed of concrete, adding perhaps 1-3 tCO2e/parking stall (at a cost of perhaps $50,000 per stall) for an above grade garage. While below grade parking garages are preferable from an urban standpoint, removing and hauling soil away can add 4 kgCO2e/parking stall to the parking garage total. This increases residential and commercial costs and leaves less land available for open space or housing, decreasing affordability.
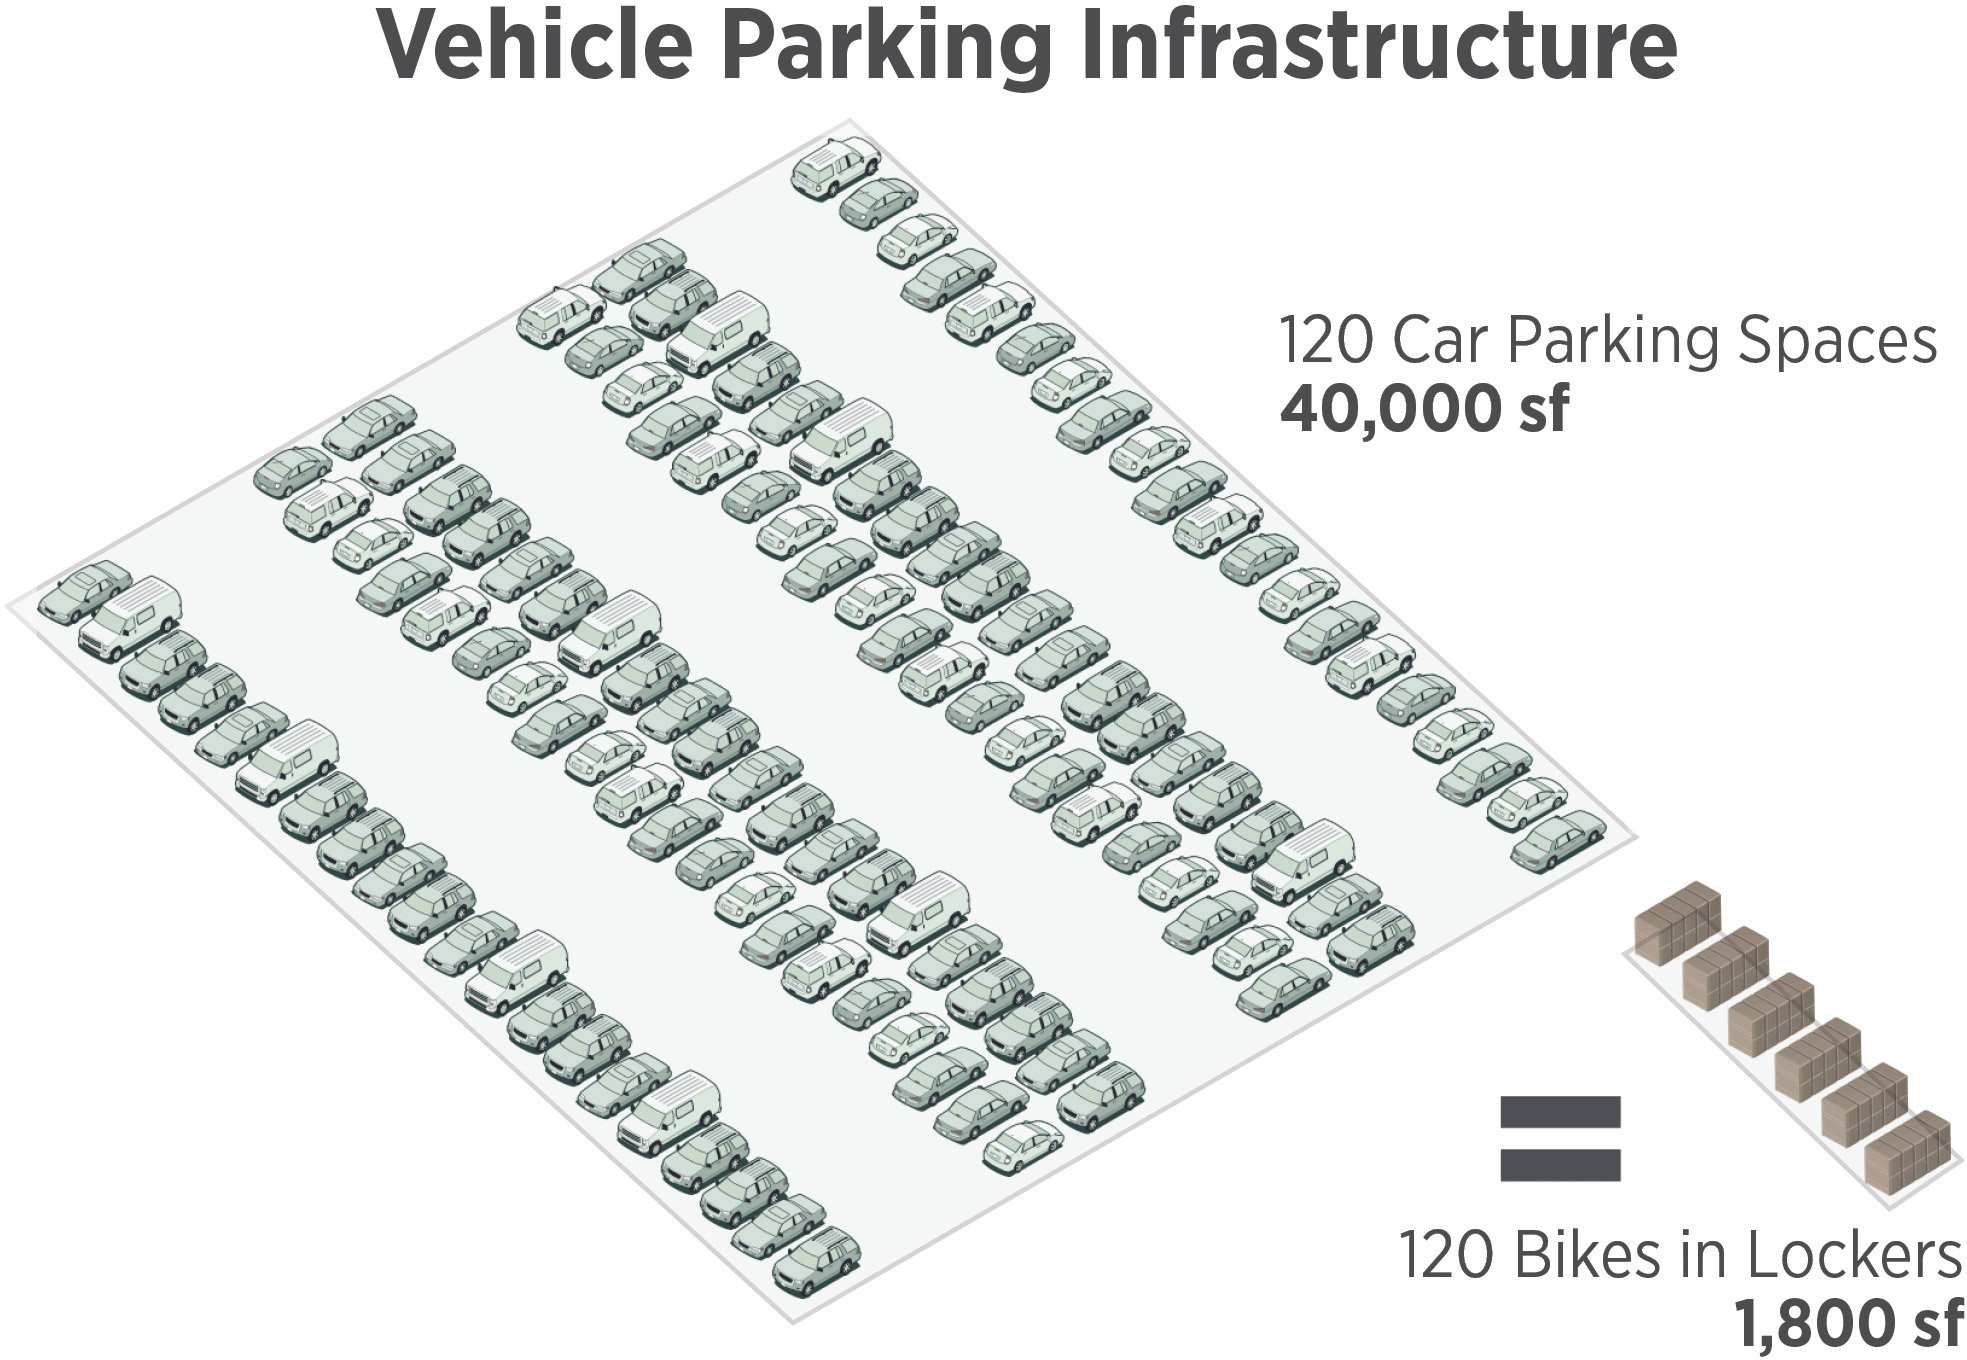
Cars require large spaces and structures for parking and maneuvering, whereas bikes and micro-mobility take 20 times less parking space when stored in secure bike lockers. Transitioning to electric vehicles doesn’t reduce these costs or land uses, but building or re-allocating infrastructure for non-car mobility does. Graphic per CycleSafe
Infrastructure
Massive infrastructure serves our daily needs, and will need to be repaired and rebuilt over the coming decades. Roads, freeways, bridges, electricity towers and lines, power generation, data cables, water supply and waste, stormwater, gas piping, plus sitework and parking. Most of these are made of metals and concrete that have high embodied carbon. A suburban home may be zero carbon operationally, but the infrastructure to support it may be much higher than in a dense, urban area due to the length of infrastructure to serve single family homes.
Contrary to popular belief, widening roads has no long term impact on reducing traffic, instead encouraging people to drive farther while costing money and carbon pollution for roadway construction. The roadway to accommodate 200 people in cars within traffic requires over 3,300 ft of lane, while other mobility forms have lower embodied carbon infrastructure and land use.
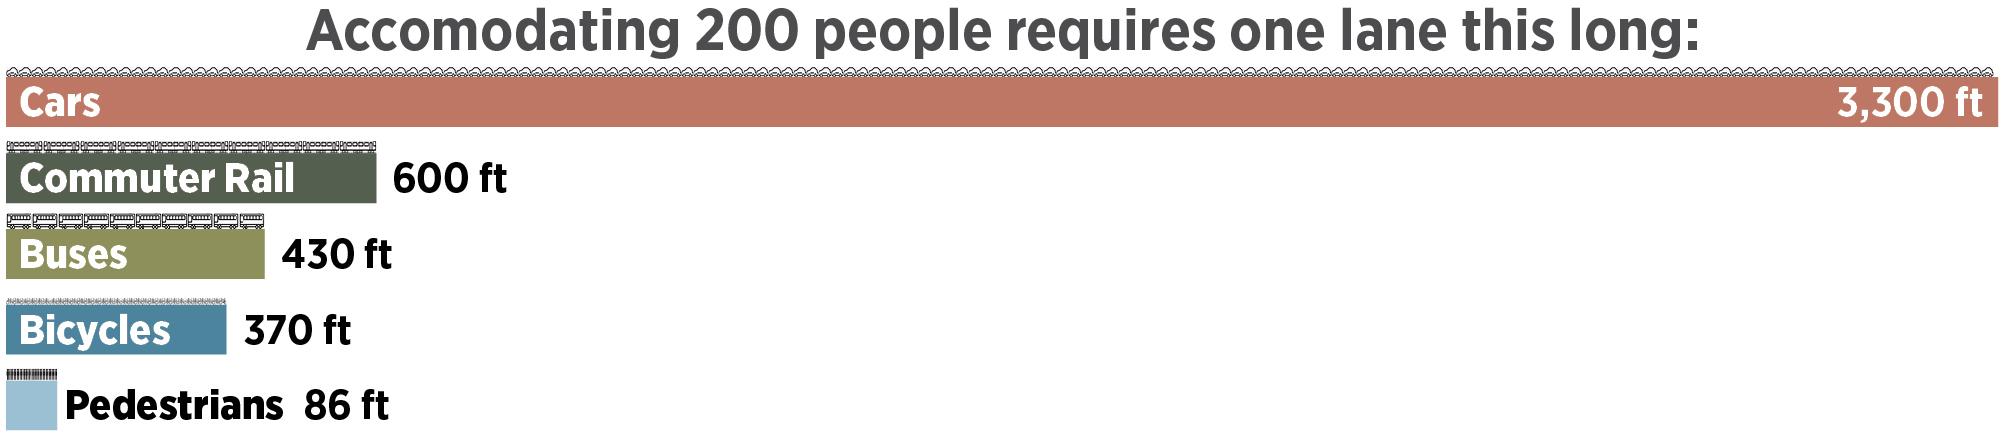
The amount of infrastructure required for transportation options varies based on how much space is required for the vehicles, which has a direct impact on the embodied carbon of the infrastructure. Taken from a video by PTV Group. Numbers are based on average occupancy during commute time.
Civil engineering has an immense role to play. Non-building infrastructure accounts for about half of concrete use for roadways and rail lines, stormwater drainage and storage, retaining walls, runways, and much more. The strategies discussed in Post 11 for lowering the embodied carbon of concrete can also generally be applied to civil infrastructure, with lower-carbon roadways already envisioned. Lower-carbon structural steel is also in development, along with lower-carbon transportation options.
Since future infrastructure will have lower embodied carbon, prioritizing repairs and only new infrastructure that contribute to the low carbon transition will help us meet global carbon pollution goals.
Construction Carbon
Comprehensive information on emissions from construction is not yet available. Building Transparency (creators of the EC3 tool) convene ContractorsCAN (Carbon Action Network) and the Association of General Contractors also convenes a carbon group to fill in the missing information.
Most Life Cycle Analysis (LCA) that calculate embodied carbon use default or average values for modules A4 (transportation of materials to the site) and A5 (emissions from construction activities). Advanced contractors are now tracking fuel and energy use from on-site dirt movers, cranes, construction vehicles, temporary power, gas for drying out spaces, welding, and others. Once tracked, they can be addressed since they are huge opportunities to reduce pollution breathed by workers and carbon emissions. Solid guidance and a few examples exist highlighting good practices and tracking of construction carbon. A5 also includes material purchased but not used: wasted concrete, drywall scraps, attic stock for carpet and ceiling tiles, etc are not part of a ‘design’ model but are part of the purchased materials but not installed on the final project. They may be stored, part of the waste stream, or sometimes they are used on a different project if salvageable.
Energy intensive (often diesel) construction vehicles are difficult to decarbonize; electric versions are being produced but come with challenges such as additional time for charging or swapping batteries. R99 (meaning 99% fossil fuel reduction) is a drop-in replacement for diesel without the challenges of biodiesel that has issues with cold and storage. R99 significantly reduces fossil fuel use, and the total carbon pollution reduction, including production, is around 50-75%.
The construction phase is also where final decisions of which materials to use are made, often primarily based on cost and adherence to project requirements. A GC can fail to procure low-carbon materials in the specification, purchase from remote areas with significant transportation distances, or reduce emissions well beyond what is in the construction documents. The free, online EC3 Tool, originally created for contractors, can be used to track each material and associated A1-A5 GWP, comparing them against each other and aggregating them toward project GWP goals. A bid leveling function is also available.
Design teams are also responsible for some construction emissions. Earth removal and earth moving can also be a huge carbon emissions source (see parking section above), but responsibility for these emissions are squarely based on the design team’s decisions. Demolition scope is also based on owner and design team decision. Design also can require on-site welding, driving up A5 emissions. Deconstruction, where building components are reused in a second or third life, must be allowed for within the project schedule and fee as well.
Until temporary power is secured, most job site electricity is supplied by generators burning diesel and polluting air for workers. Diesel also often has higher carbon emissions than connecting to electricity directly. Rentable job site batteries, early connection to temporary power, and using renewable R99 diesel are strategies to reduce these carbon emissions.
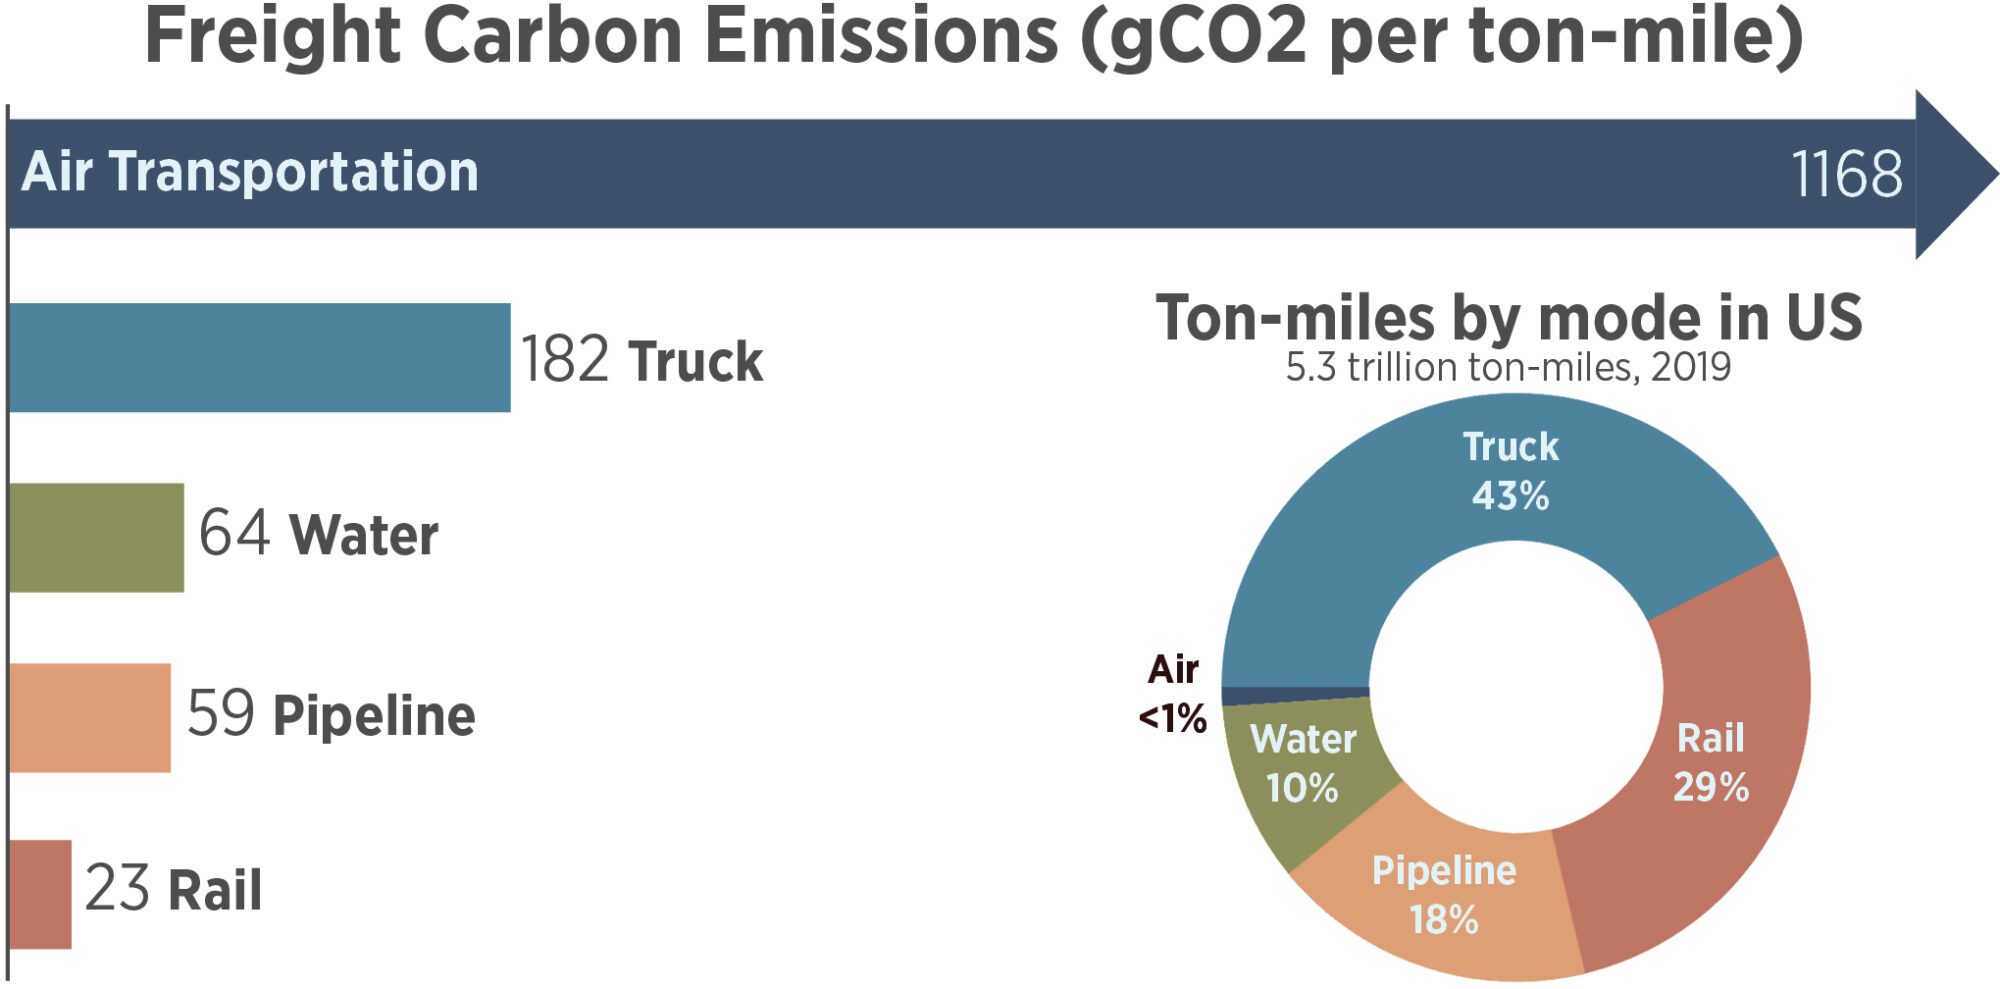
Transportation emissions are often calculated in ton-miles (emissions per ton transported one mile) for common freight transportation in the US, showing truck transportation is almost 8x the carbon pollution of rail transportation. The pie chart shows the prevalence of each mode in terms of total annual miles.
What is Watergy?
Watergy refers to the carbon pollution from water delivered to a site (collection, pumping, storage, treatment), the carbon pollution from treating it after use (pumping, treating), and the carbon pollution in all of the infrastructure to do these things. The numbers are not well understood and vary widely since water is almost always local. Roughly 2% of US energy use (perhaps 4%), is for pumping and treating wastewater and water, including irrigation, while energy use is up to 40% of the cost of water supply.
Water use in buildings for drinking, hand-washing and flushing toilets (LEED’s indoor water use credits) is generally minor compared to water used for cooling fossil and nuclear power plants, demo and construction water use, materials manufacturing, irrigation, cooling towers, and other miscellaneous process water use in buildings. But since water is always a local or regional resource, too much at one time or too little over a long period can be disastrous.
Water use has other carbon effects: pumping water from one place to another and desalinization require significant energy resources and claims dating from a hundred years ago on the Colorado River, for example, underlie lawsuits about water rights that are likely to lead to the abandonment of some agriculture and towns. Las Vegas, for example, recycles and reuses most of its water, which increases energy use but helps with water scarcity issues.
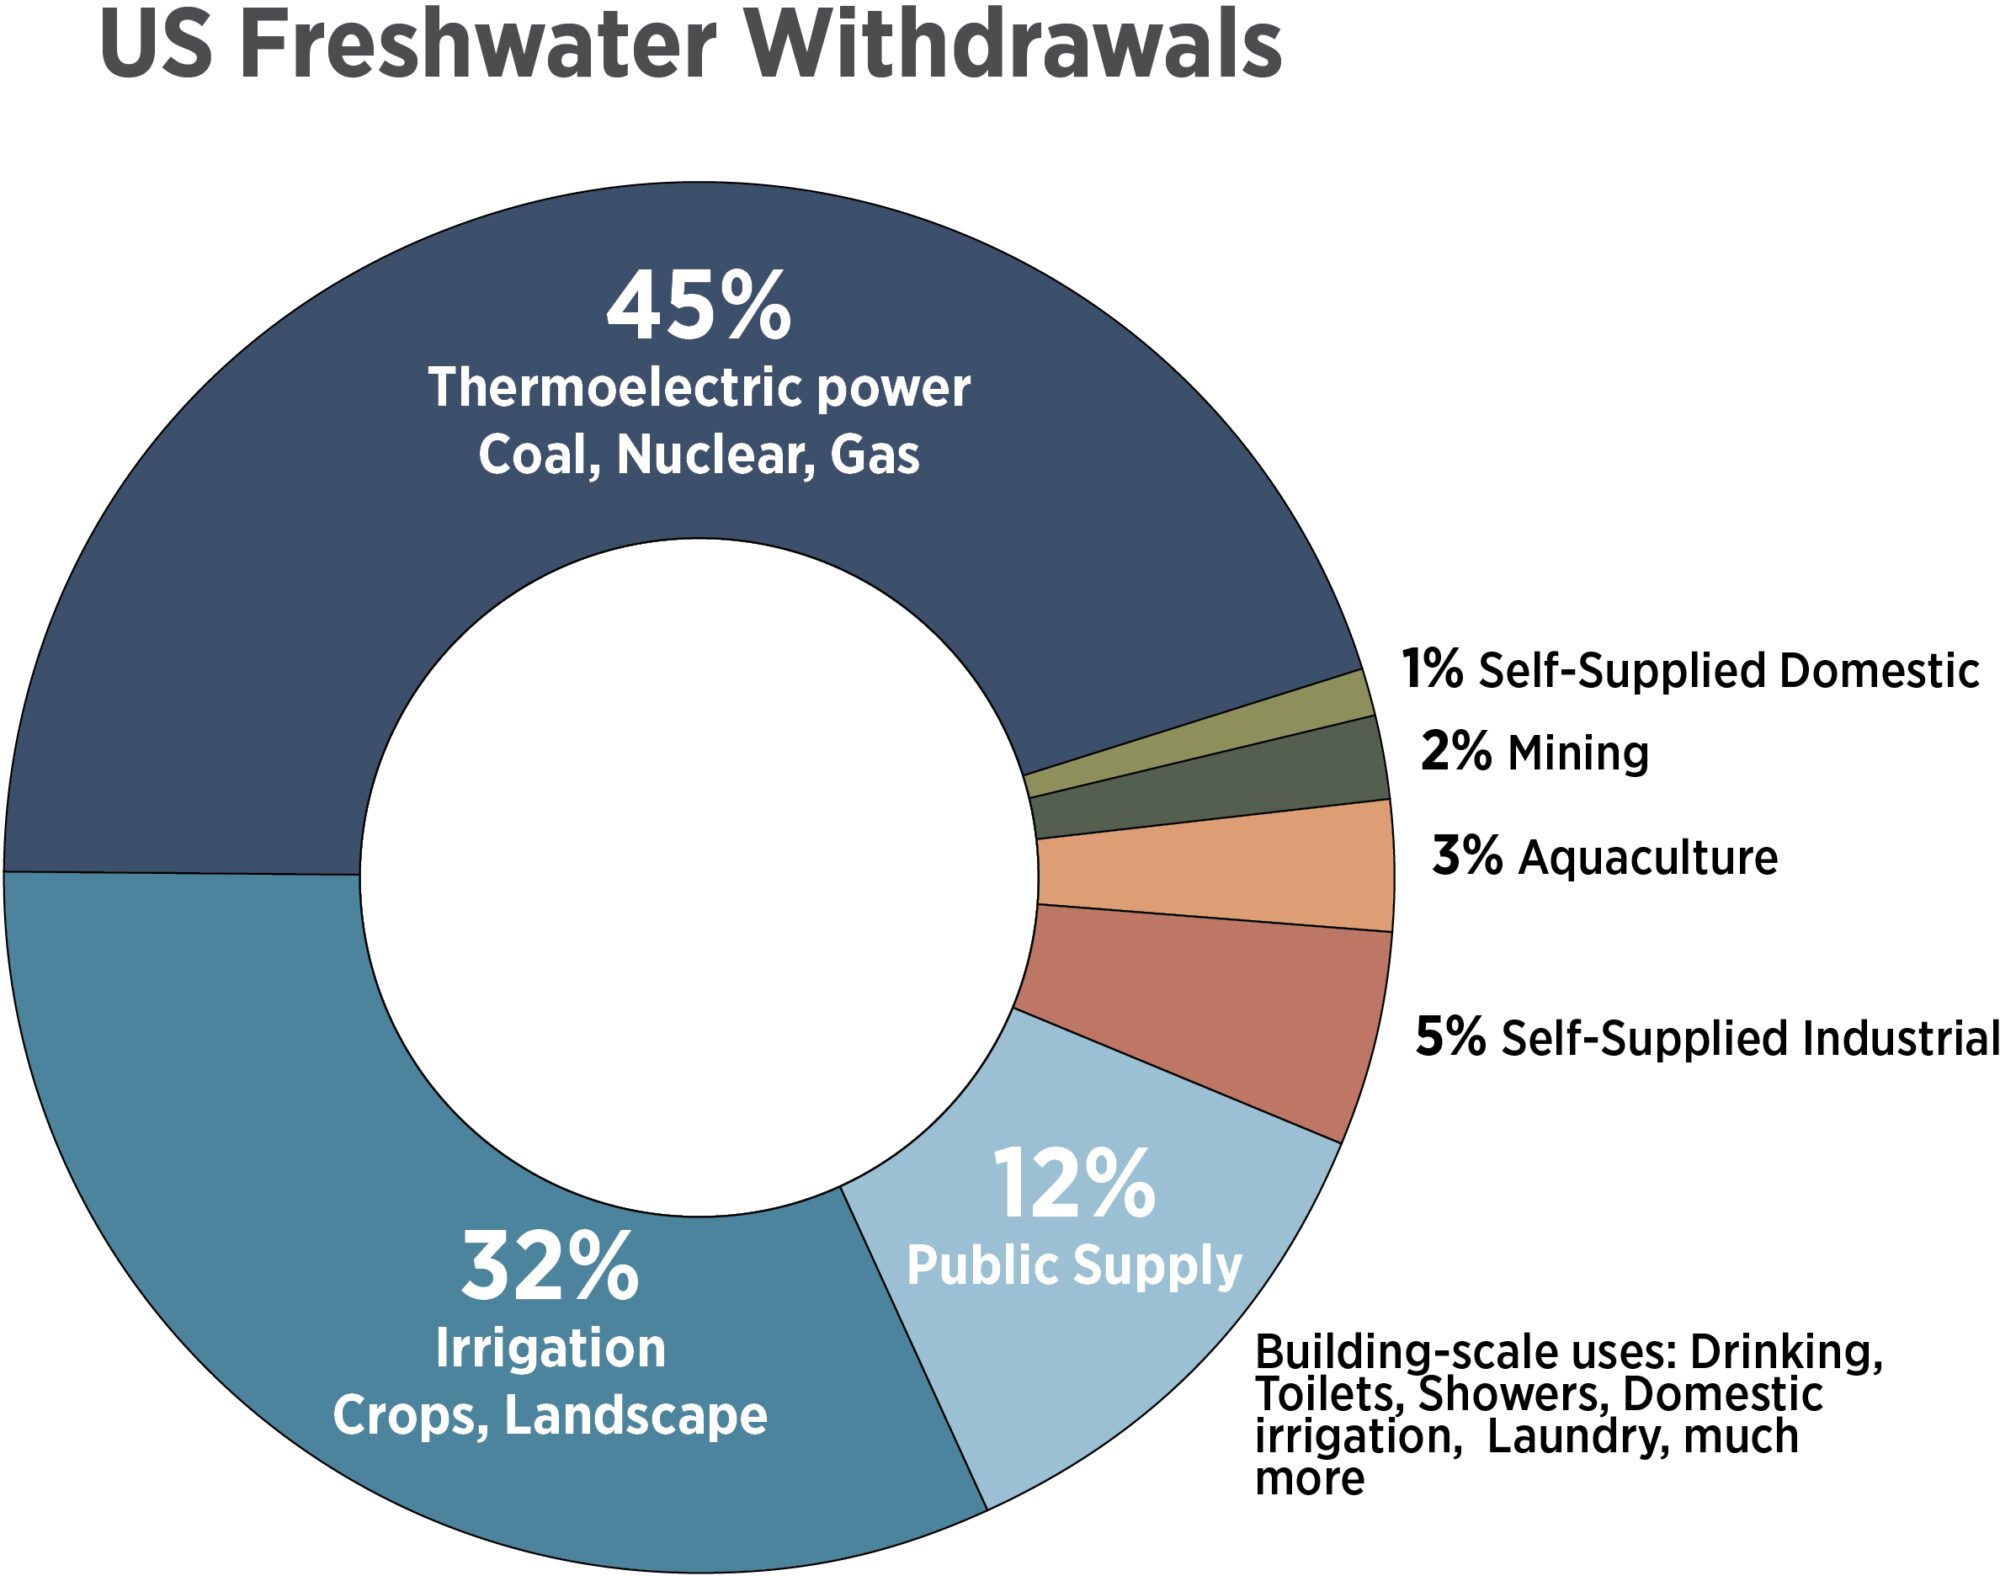
US water (tracked by the EPA) is primarily used for thermoelectric electricity generation from fossil fuel and nuclear plants as well as agriculture, meaning that reducing energy use and transitioning to renewable energy will reduce total freshwater use. Thermoelectric power plants are non-consumptive, meaning they return (much warmer) water to freshwater sources. Agriculture accounts for 80-90% of consumptive uses, meaning the water is not returned to freshwater supply.
Water use during demolition (to minimize dust) can be significant. Often one or more constant streams of water are projected onto any portion being demolished every day. In some early tracking, Skanska estimated that this was around 2.6 gallons per sf of demolished area. Using site stormwater or other non-potable water reduces the carbon emissions and strain on local water supplies. Using deconstruction can also minimize water use.
Landscape and Site
Landscape carbon pollution and sequestration are an emerging area. The Pathfinder Tool and Carbon Conscience Tool can be used to estimate carbon flows – immediate and over time – in landscape and hardscape site designs. Pathfinder also includes strategies to reduce total carbon with more detailed information here and here. Carbon Conscience has documentation here and here, based on this data. C.scale/EPIC also includes hardscape, landscape, and greenfield disturbance embodied carbon methods.
What are early areas of focus for low-carbon and carbon-sequestering site design? While plantings can sequester carbon if cared for over the long term, many site designs take decades or longer to become net carbon sequestering due to materials choices and construction carbon pollution.
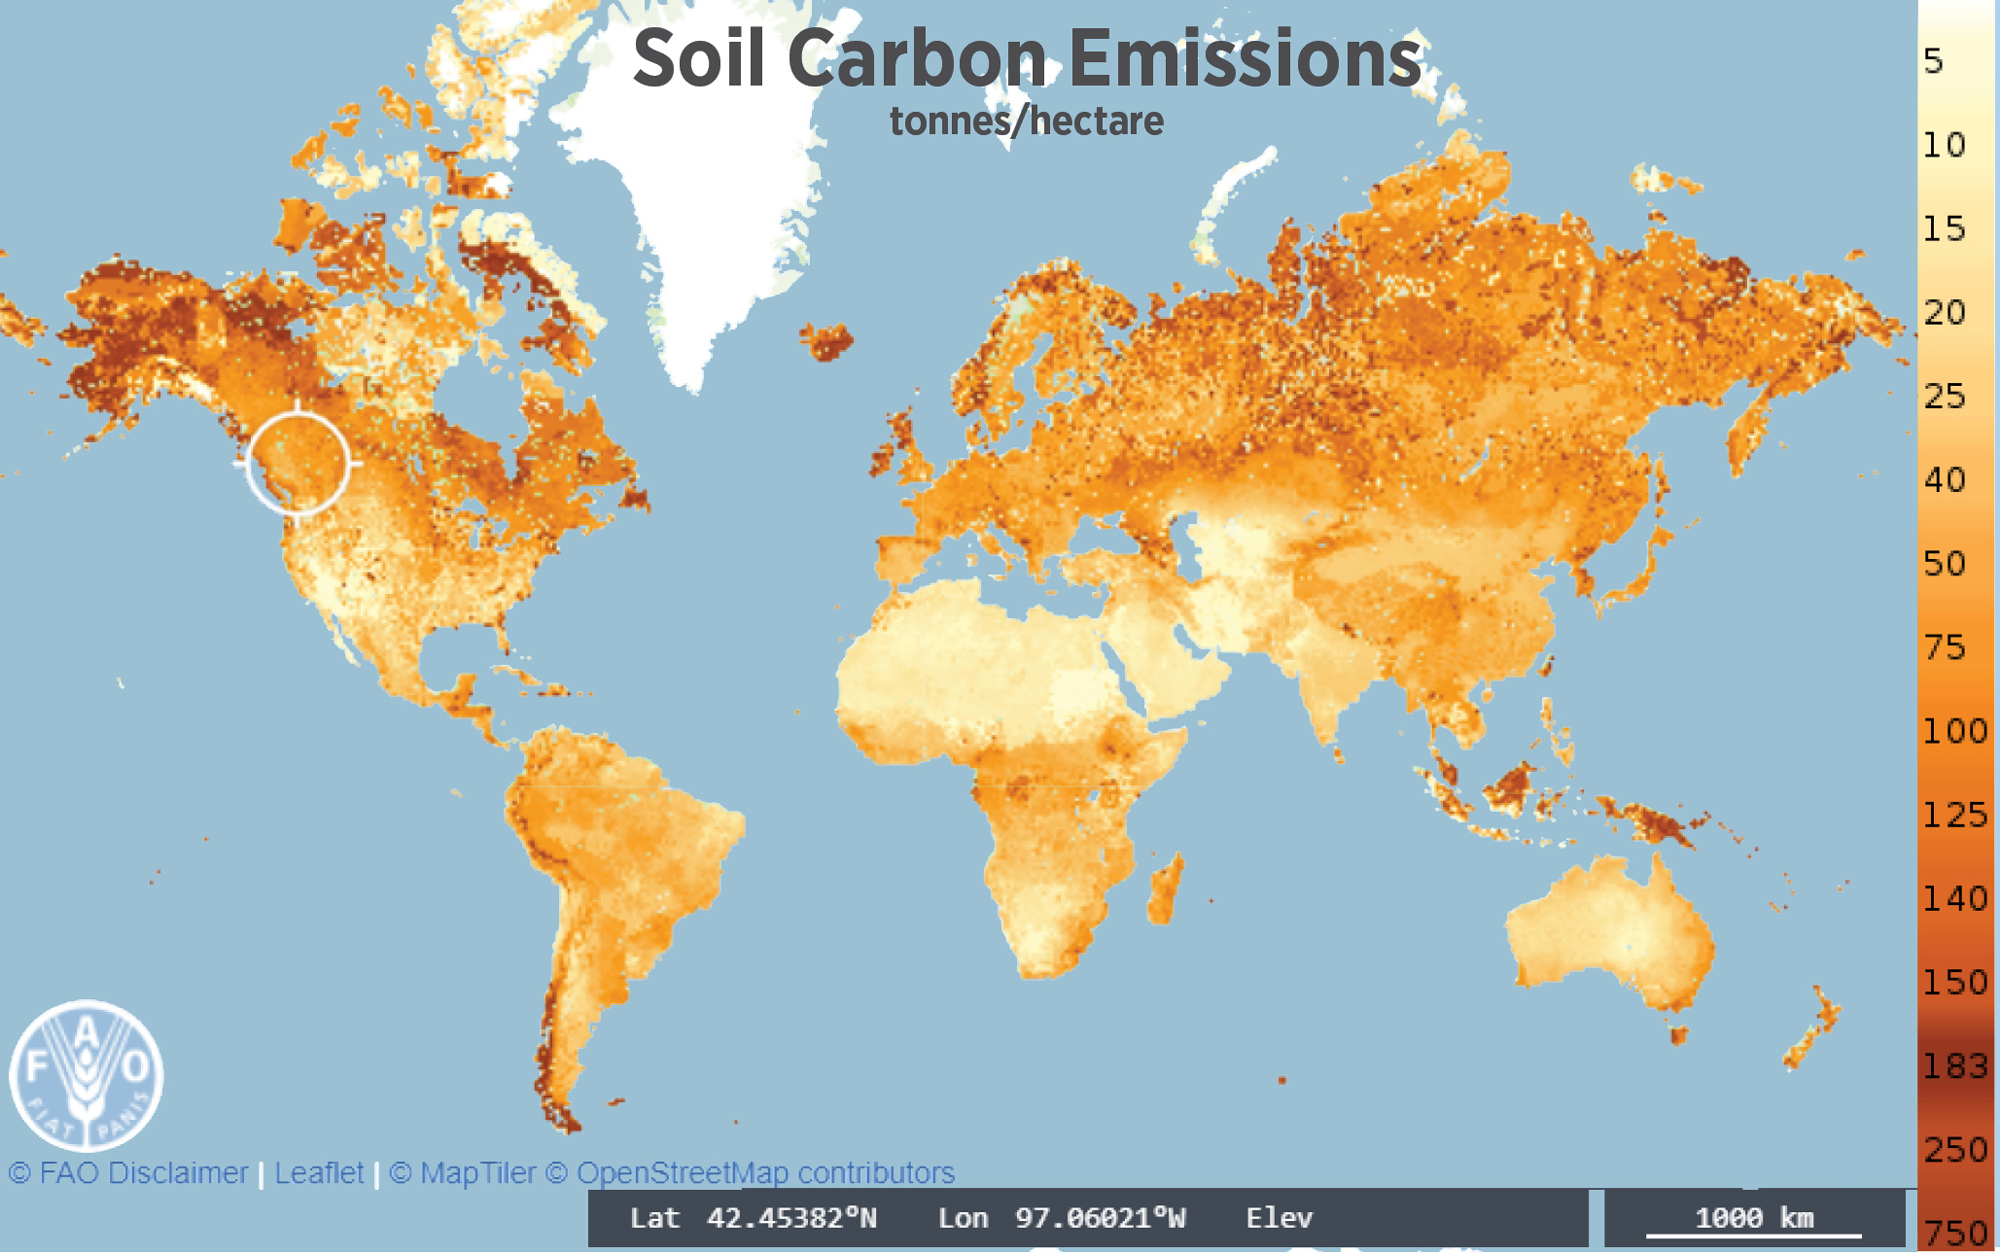
As mentioned earlier, trucking soil added or removed from the site is one of the biggest sources of carbon pollution from landscapes and site work due to diesel machinery that is often used. Beyond this, any time soil is disturbed for construction, carbon may be released through decay of soil organics, especially on greenfield sites. A map from the UN shows the density of carbon within soils, see below.
On the materials side, hardscape elements generally have the highest emissions as they are primarily concrete, metals, and plastics. The tools above include these impacts as an order of magnitude assumption, cautioning that these estimates are based limited data for now. Geofoams, used for lightweight cover over underground structures or on terraces, are often fossil fuel based EPS or XPS. While they reduce the structural requirements for below grade construction, alternative designs can eliminate their need, and alternatives such as foamed glass aggregates are available to reduce site embodied carbon.
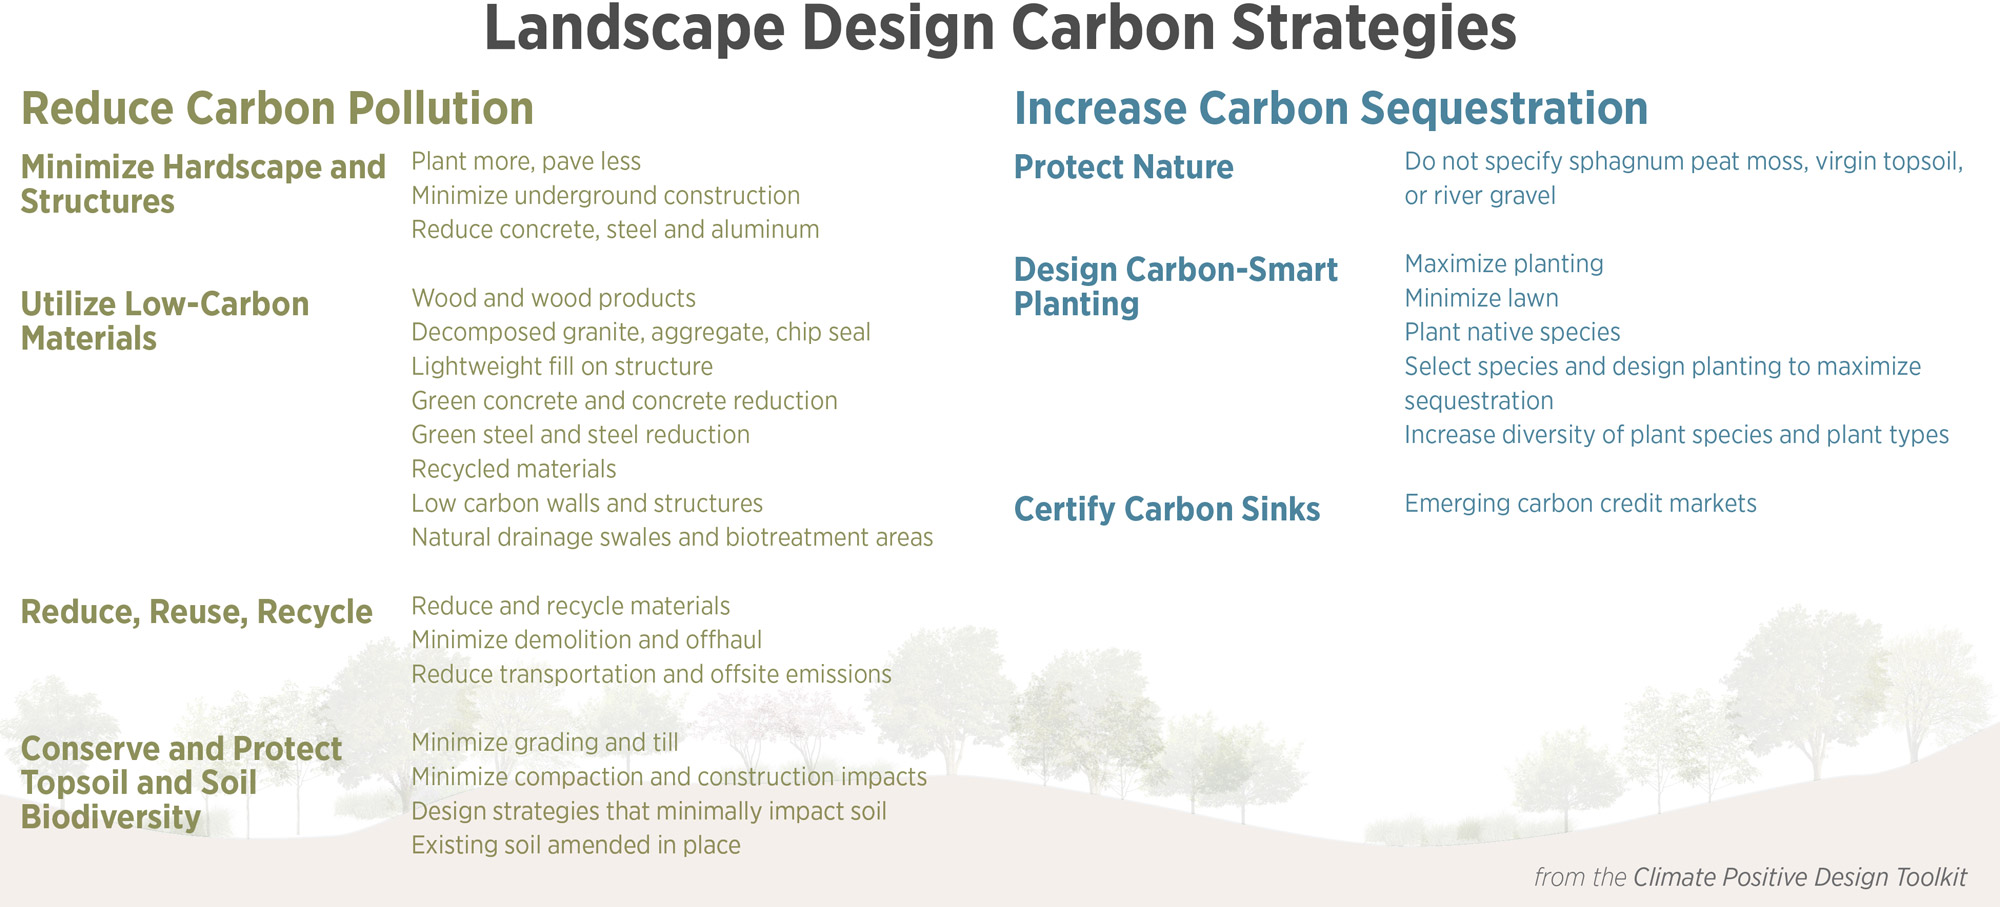
Site design carbon calculator Pathfinder includes the complexity of site and landscape design carbon emissions and sequestration over time. The associated Design Toolkit includes the above strategies with more detail.
Green roofs, or landscape on terraces, are nearly always a source of emissions, since terrace soil is not connected to deeper soil where carbon could be stored over the long term.
Landscape and site design also have important effect on local temperature via the heat island effect, influencing HVAC cooling use, passive survivability, and outdoor thermal comfort. Lowering the ambient air temperature using landscape can lower summertime cooling loads, as well as blocking solar gain in windows.
Conclusions
Carbon neutrality goals and claims need to extend well beyond the building, from land use planning to construction and site design. At a minimum, carbon neutral ambitions should include transportation, the embodied carbon of new renewable energy generation, actual A4-A5 emissions and demolition emissions, and site emissions from landscape, hardscape, parking, and on-site roadways. While the earth’s ecosystems will eventually adapt to higher sea levels and more extreme temperatures, humans (and other species) will suffer the worst.
Please email any questions or comments to Kjell Anderson, kanderson@lmnarchitects.com
Thanks to our external collaborators and peer reviewers
Mark Chen; Peter Alspach, McKinstry; Margaret Montgomery, NBBJ; Kelly Alvarez Doran, Ha/f; Alejandra Hinojosa, SWA Group; Jesce Walz, Perkins + Will; Don Davies, Davies-Crooks; David Mead, PAE
LMN Architects Team
Jenn Chen, Justin Schwartzhoff, Kjell Anderson
Posted: 04/08/2024
The text, images and graphics published here should be credited to LMN Architects unless stated otherwise. Permission to distribute, remix, adapt, and build upon the material in any medium or format for noncommercial purposes is granted as long as attribution is given to LMN Architects.