#pathtozerocarbon, #sustainability
02 – Who’s Responsible for Carbon Emissions, Anyway?
How do we determine who is responsible for carbon pollution within the built environment? This article identifies how organizations track their carbon pollution, considers design teams’ contribution, and begins investigating magnitude.
It’s Mostly Fossil Fuels
Carbon pollution that causes climate change is almost exclusively created from the production and use of fossil fuels (Post 04). Fossil fuel companies have lobbied successfully for a comprehensive suite of policies and incentives that encourage or require us to buy fossil fuels for transportation and heating, and within the products we buy, as well as subsidies for the industry to make them appear less expensive.
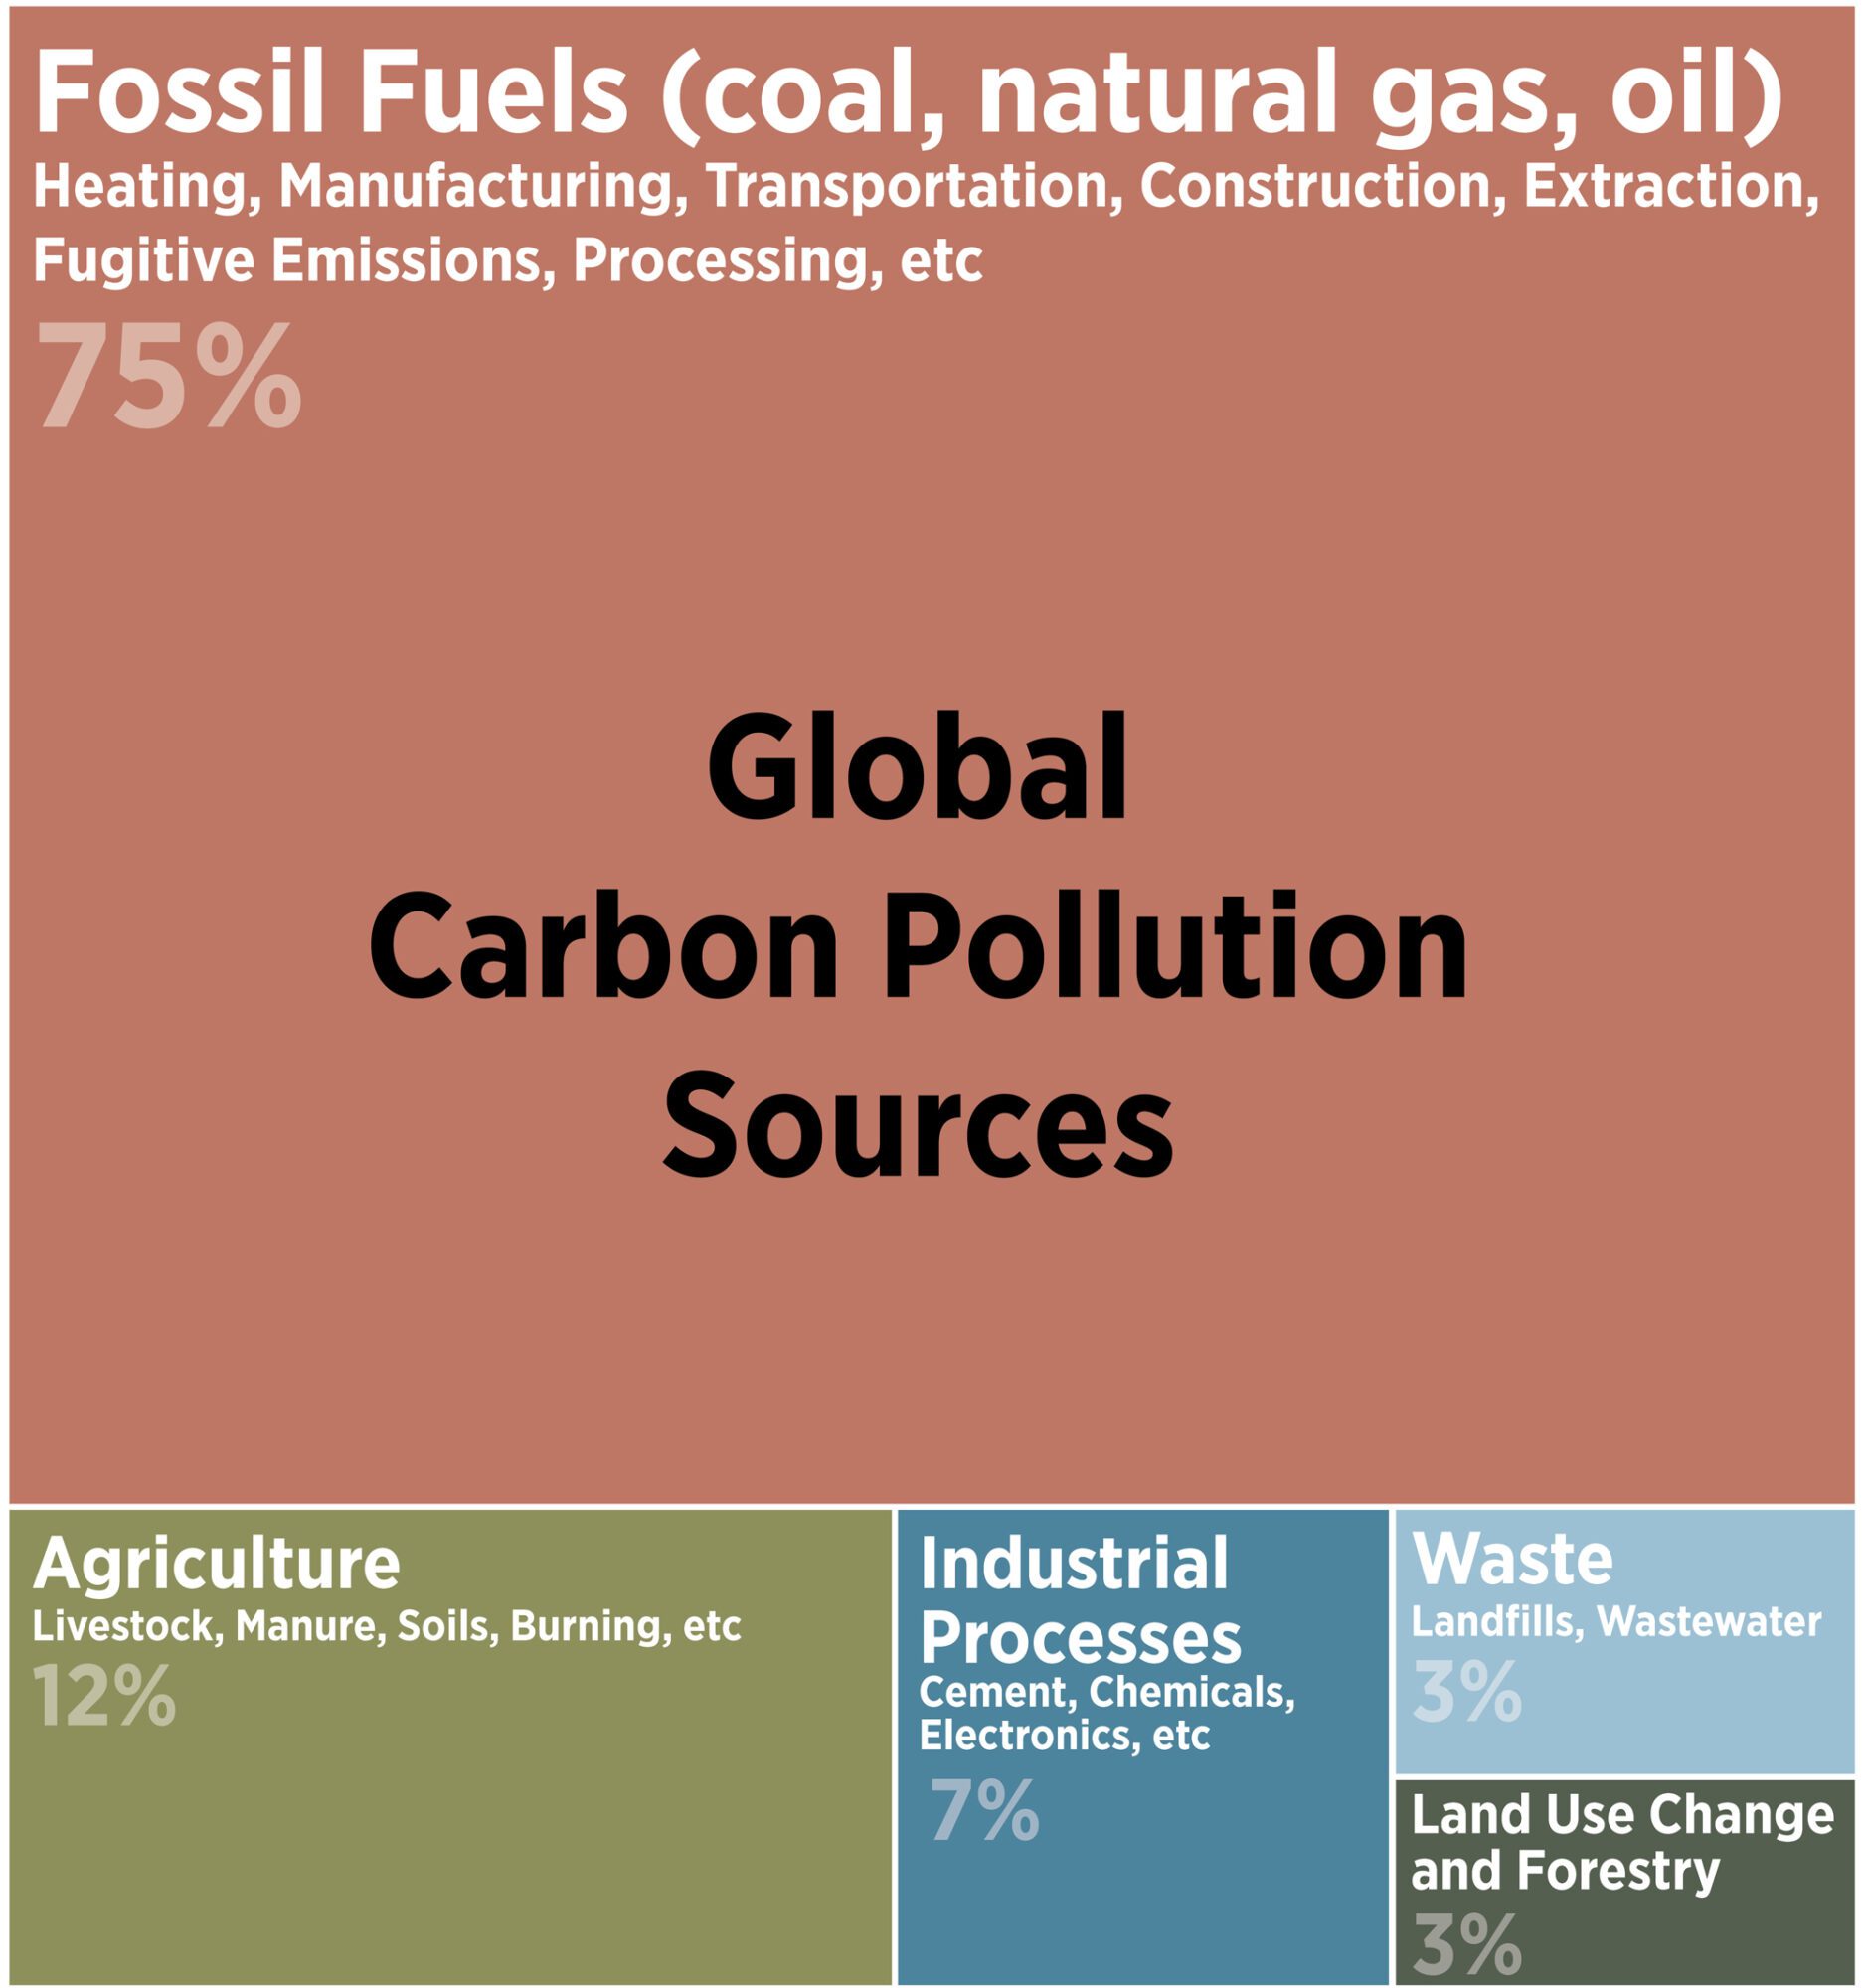
Carbon Pollution is primarily due to the extraction and use of fossil fuels. Carbon Pollution is another name for human-caused Greenhouse Gases that heat the planet beyond the recent, stable levels that have supported human flourishing. Based on data used by the World Resources Institute.
They have also successfully shifted the apparent responsibility onto the public by promoting the idea of a personal carbon footprint, which has the psychological effect of shifting guilt and complicity onto individuals who are nearly forced to use their products, and away from the profit motive and system-wide changes in laws and policy required to address climate change at a scale equal to the challenge.
Despite the fundamental flaw by shifting responsibility, carbon footprinting is commonly used by businesses, governments, and non-profits to understand and address sources of pollution that they control most directly. It is having some positive, if delayed, effects. Carbon footprints impacts are largely due to fossil fuels used directly and in the supply chain, so carbon footprint reductions are primarily reductions in direct and indirect use of fossil fuels.
While some companies are motivated by altruism to go fossil fuel free, most companies choose electrification because it provides advantages. Electricity grids that run on solar and wind power with batteries are cheaper than fossil fuel electricity generation since there’s no fuel cost. Small and inexpensive batteries provide on-demand energy with no moving parts. Electricity creates no air pollution and doesn’t need complicated exhaust system from buildings.
To be clear, fossil fuels have enabled great human progress. We now have cleaner, preferable alternatives, but fossil fuel use is prevalent based on the built environment we designed around cheap fossil fuels. This includes land use that limits housing to single family plots (consigning us to cars), utility monopolies that provide dirty and expensive electricity to us, subsidies of money and military that artificially reduce the cost of fossil fuels, subsidized roads and on street parking built exclusively for cars and trucks but not for bikes or pedestrians, inexpensive land leases to support oil extraction, and much more. Some parts of this system are covered in Post 16.
Because our society has fossil fuel subsidies and requirements embedded in it, businesses and individuals can make significant changes themselves, but must also change government policies to reach zero across their entire supply chain.
What Gets Measured, Gets Managed: the Greenhouse Gas Protocol
While zero carbon is not possible now, many companies are charting a realistic but aggressive course. Others do not intend to take action, and have made plans that require action far in the future or involving vast purchases of cheap and problematic carbon offsets (Post 08).
The Greenhouse Gas Protocol Corporate Standard framework is the most common way for entities to understand and track their carbon pollution, categorizing pollution sources as Scopes 1, 2, and 3. This standard is recognized by over 97% of Fortune 500 companies, educational institutions, and many countries and cities. Many companies report these pollution scopes though transparency organizations like CDP. The GHG Protocol is in the process of a major update that may be released in 2027 and take effect in the early 2030s.
- Scope 1: Direct carbon pollution controlled by an entity, primarily from owned vehicles and on-site combustion such as fossil fuel fired boilers in buildings.
- Scope 2: Indirect carbon pollution from purchased energy, primarily electricity.
- Scope 3: Optional, unless complying with the GHG Scope 3 Standard. Scope 3 includes purchased goods and services (upstream) as well as others’ use of products sold by the company (downstream). This includes any pollution from third parties that are integral to the business. The boundary for Scope 3 is not clearly defined, and some companies report only a partial Scope 3. CDP estimates that Scope 3 supply chain emissions are 26 times higher than Scope 1 and 2 operational emissions, with guidance for the major upstream (suppliers to a company) and downstream (users of a companies’ products) categories in the Scope 3 Standard.
Many organizations align their goals with the Science Based Targets Initiative (SBTI) (such as Hines), the 2030 Challenge (adopted as the AIA 2030 Commitment by 600+ architecture firms) the Carbon Risk Real Estate Monitor (CRREM) the Urban Land Institute’s Net Zero Imperative, or company specific 1.5⁰C-aligned real estate goals (although the world has already reached 1.5⁰C of warming in 2024). Roughly half of the Fortune 2000 have committed to zero by 2050 or before, though with mixes results thus far.
The Carbon Risk Real Estate Monitor (CRREM) curve suggests many existing buildings – and new ones that are not sufficiently low-carbon – will become stranded assets unless they decarbonize as the market and regulations demand continually lower-carbon buildings. CRREM also provides a risk assessment document here.
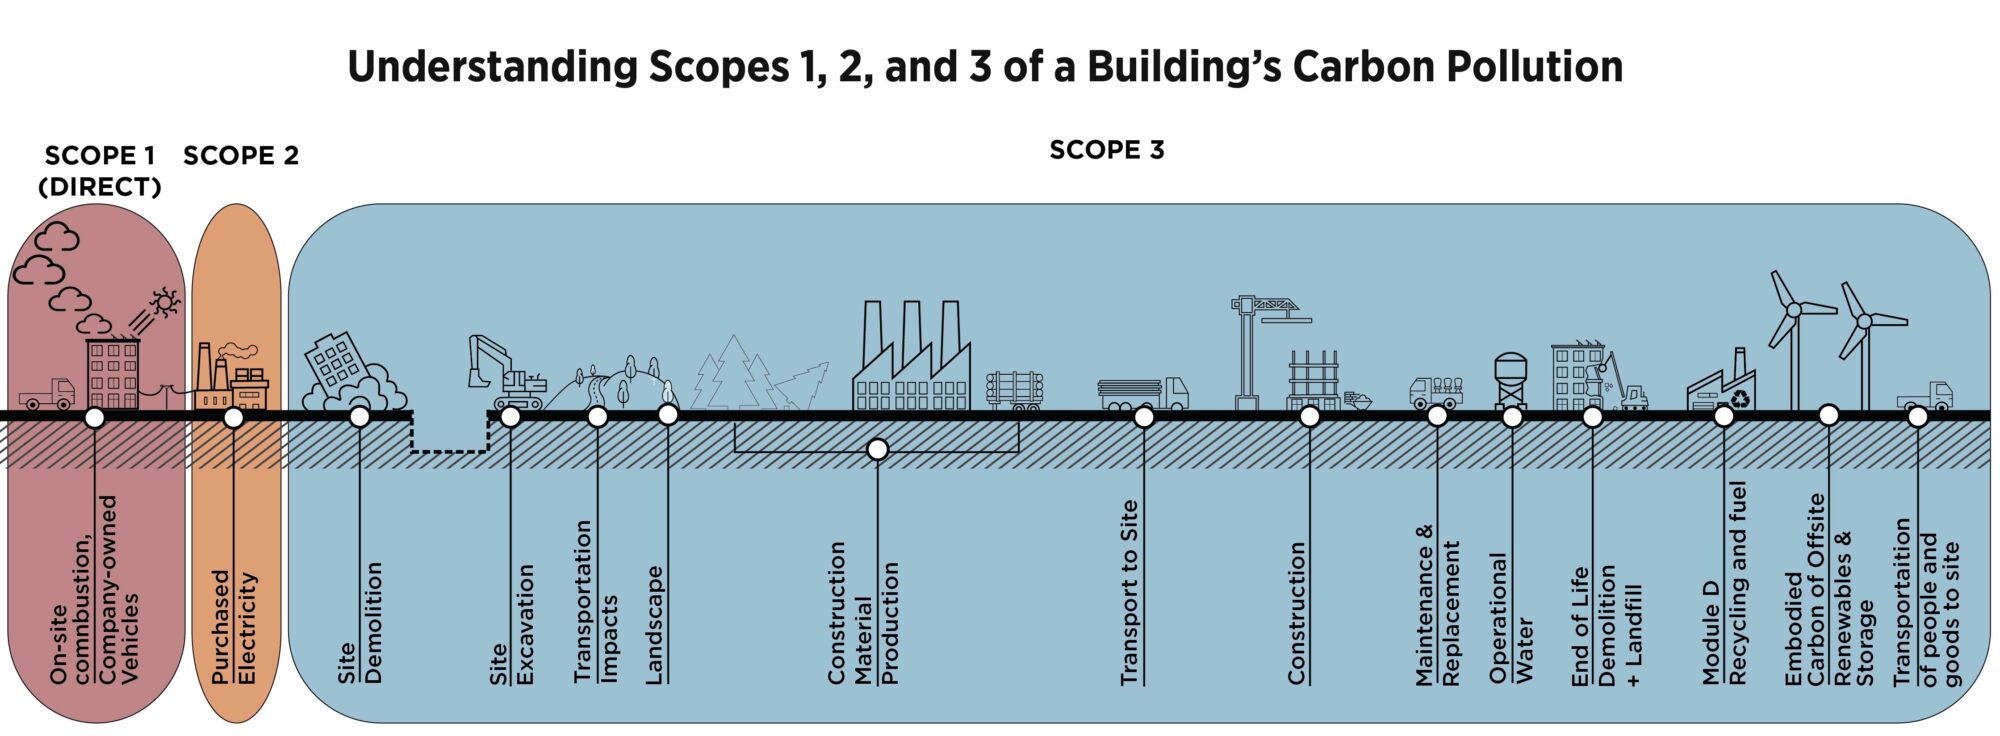
The Greenhouse Gas Protocol Corporate Standard organizes carbon pollution reporting into Scope 1, 2, and 3. Most building-related pollution is illustrated in this diagram.
An illustrated example of Scopes 1, 2, and 3
An architecture firm’s carbon footprint is below, showing that the direct carbon footprint of energy, operations, business travel, commutes, etc is very small compared to the overall impact of the company’s work: in this case the projects are 2400x the impact of direct energy purchases, and 600x the impact of all operations.
This plays out through the business world: upstream and downstream impacts are orders of magnitude larger than the direct impacts and need to be considered as companies invest in reducing their carbon footprint.
With the design and construction industry responsible for design, coordination, specifications, procurement, installation, reuse, and sometimes maintenance of buildings, we also bear much of the responsibility for each building’s carbon pollution. Despite budgets and other constraints not allowing complete latitude, we have significant pull as trusted advisors to our clients in shaping their goals, in creating demand for low-carbon products, and by tracking and reducing a building’s pollution.
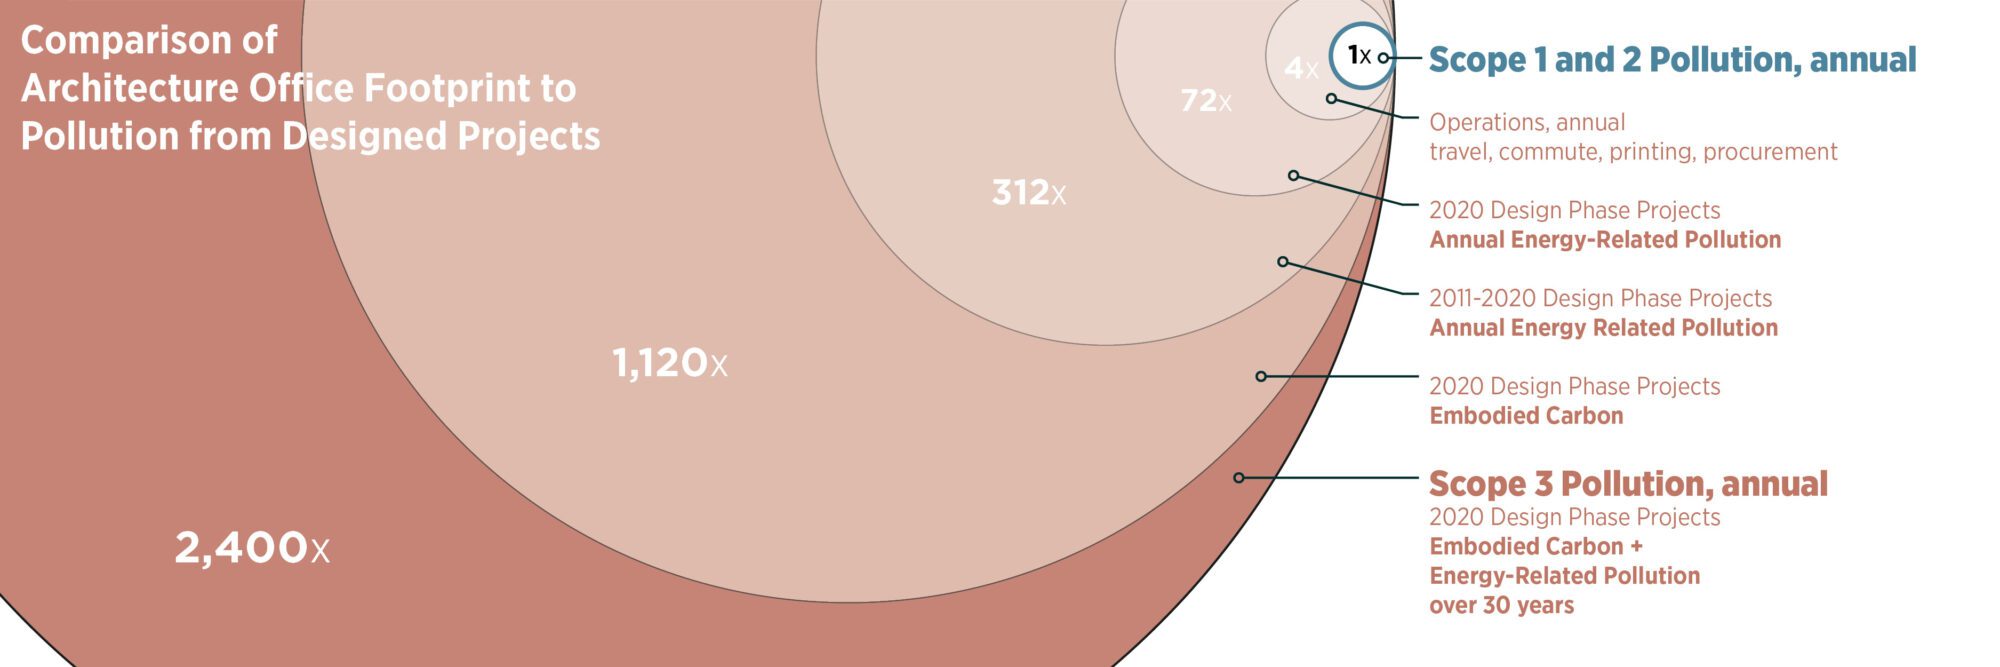
As an example, LMN’s office carbon pollution is around 600 tCO2e annually, which includes energy use (Scopes 1, 2, and 3.3), supplies and printing (Scope 3.1), commutes (3.7), business travel (1 and 3.6), waste (3.5) and more. These are dwarfed by the pollution from embodied carbon and energy use from just one year of project we design. LMN’s projects total more than 2,400x our annual office carbon footprint’s Scope 1 and 2, even though half of LMN’s buildings (by count and total area) from our 2020 reporting year are on track to be certified as ‘Zero Carbon’ through ILFI’s Zero Carbon or USGBC’s LEED Zero Carbon program.
Buildings and Climate Responsibility
The buildings industry does not fit well with Scopes 1-3 reporting, but if we assume that buildings and sites are ‘products,’ we can use the same standard as most other companies, especially for our upstream and downstream Scope 3 pollution.
Scope 1 carbon pollution is, by definition, directly controlled by a company: primarily fuel for vehicles, fossil fuels burned on-site, and other on-site pollution. It is also unique to that company, so no other entity would count it as Scope 1. Put another way, if every company eliminated their Scope 1 pollution (primarily fossil fuels) we would live in a carbon balanced society. To provide incentives for this, market-based solutions like carbon fees are often levied on pollution from each entity’s Scope 1, called a ‘polluter pays’ system. Building Performance Standards, regulations that require energy assessments and retrofits of energy hog buildings, are becoming more prevalent in cities and states. They focus on Scope 1 and 2 pollution.
Building-Scale Solution: efficient, all-electric to eliminate polluting energy like fossil fuels on site, Posts 06, 12, 13, and 14
Scope 2. Many leading companies reduce their carbon footprint from electricity purchases further by purchasing 100% renewable energy through green tariffs or a Power Purchase Agreement (sometimes committing to the RE100): Microsoft, Apple, Google, Amazon, and Goldman Sachs are just a few. Some companies are also taking responsibility for their Scope 3 supply chains and outsourced activities, using their leverage as buyers to reduce their total Scope 3 pollution.
Building-Scale Solution: Reduce demand for electricity, same posts as Scope 1.
Scope 3. Many companies have begun to address their remaining pollution by choosing to purchase and use low-carbon products. We now have available many construction products that were not available 5 years ago: lower-GWP insulations, lower-carbon concrete, heat pump and renewables-based manufacturing for drywall, increased funding of circular economy products, and much more. A complete carbon reduction plan requires that all relevant pollution be considered, and this includes Scope 3.
Building-Scale Solution: Lower pollution from building materials and construction. Many design and construction companies do not yet include the energy use or embodied carbon of their buildings in their Scope 3 accounting and claims of carbon neutrality, but there are compelling arguments to do so as this constitutes a vast majority. Posts 07, 09, 10, 11, 15, and 16.
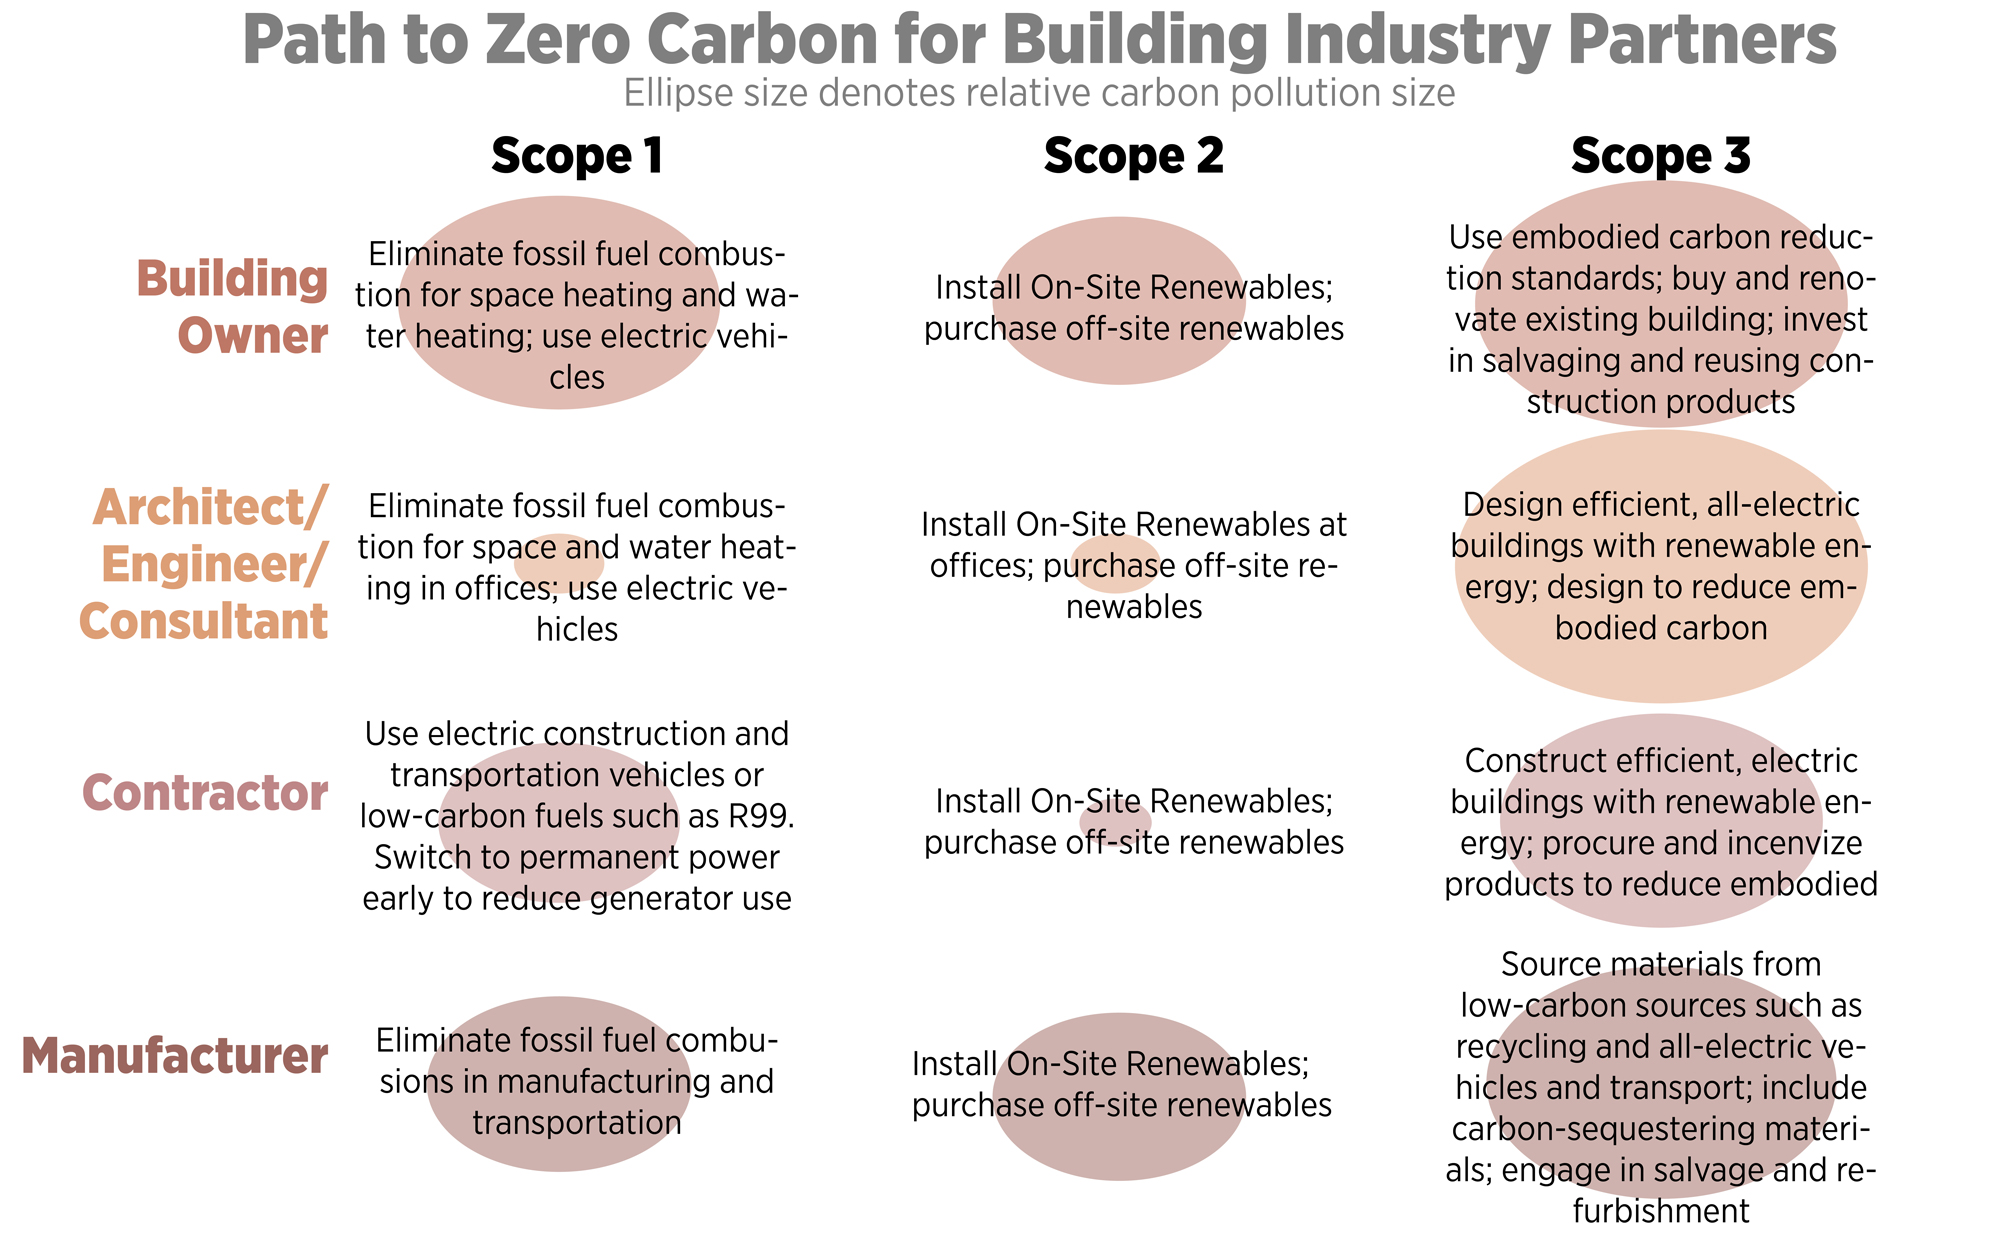
Scopes 1, 2, and 3 reduction strategies and relative importance (ellipse size) illustrate the potential of the main players in the buildings’ carbon pollution space.
Some organizations have proposed an optional Scope 4, sometimes called avoided emissions. This refers to carbon pollution avoided by the use of a company’s products or through end of life recycling. A company that, for example, provides exceptionally low-carbon cement could consider avoided emissions when people buy and use their product instead of normal cement. Since avoided emissions relies on a custom baseline scenario, it is ripe for gaming to exaggerate impact. Avoided emissions are covered in Post 08.
The GHG Protocol is useful for comparing a company’s progress, but comparing total carbon pollution between companies is not as useful as it would appear to be. This is because Scope 3 reporting is optional, less well defined, and tends to be much larger than Scope 1 and 2 because it includes many upstream and downstream impacts of a business. Another complication is that outsourcing activities shift Scope 1 and 2 activities into Scope 3; for example, a company that owns vehicles that deliver goods would include tailpipe pollution in Scope 1, whereas those same deliveries contracted to a third party would be in Scope 3. Since Scope 3 pollution is broad and optional, 15 subcategories have been developed to help understand them. The real estate industry has created its own guidance for disclosing pollution based on these subcategories.
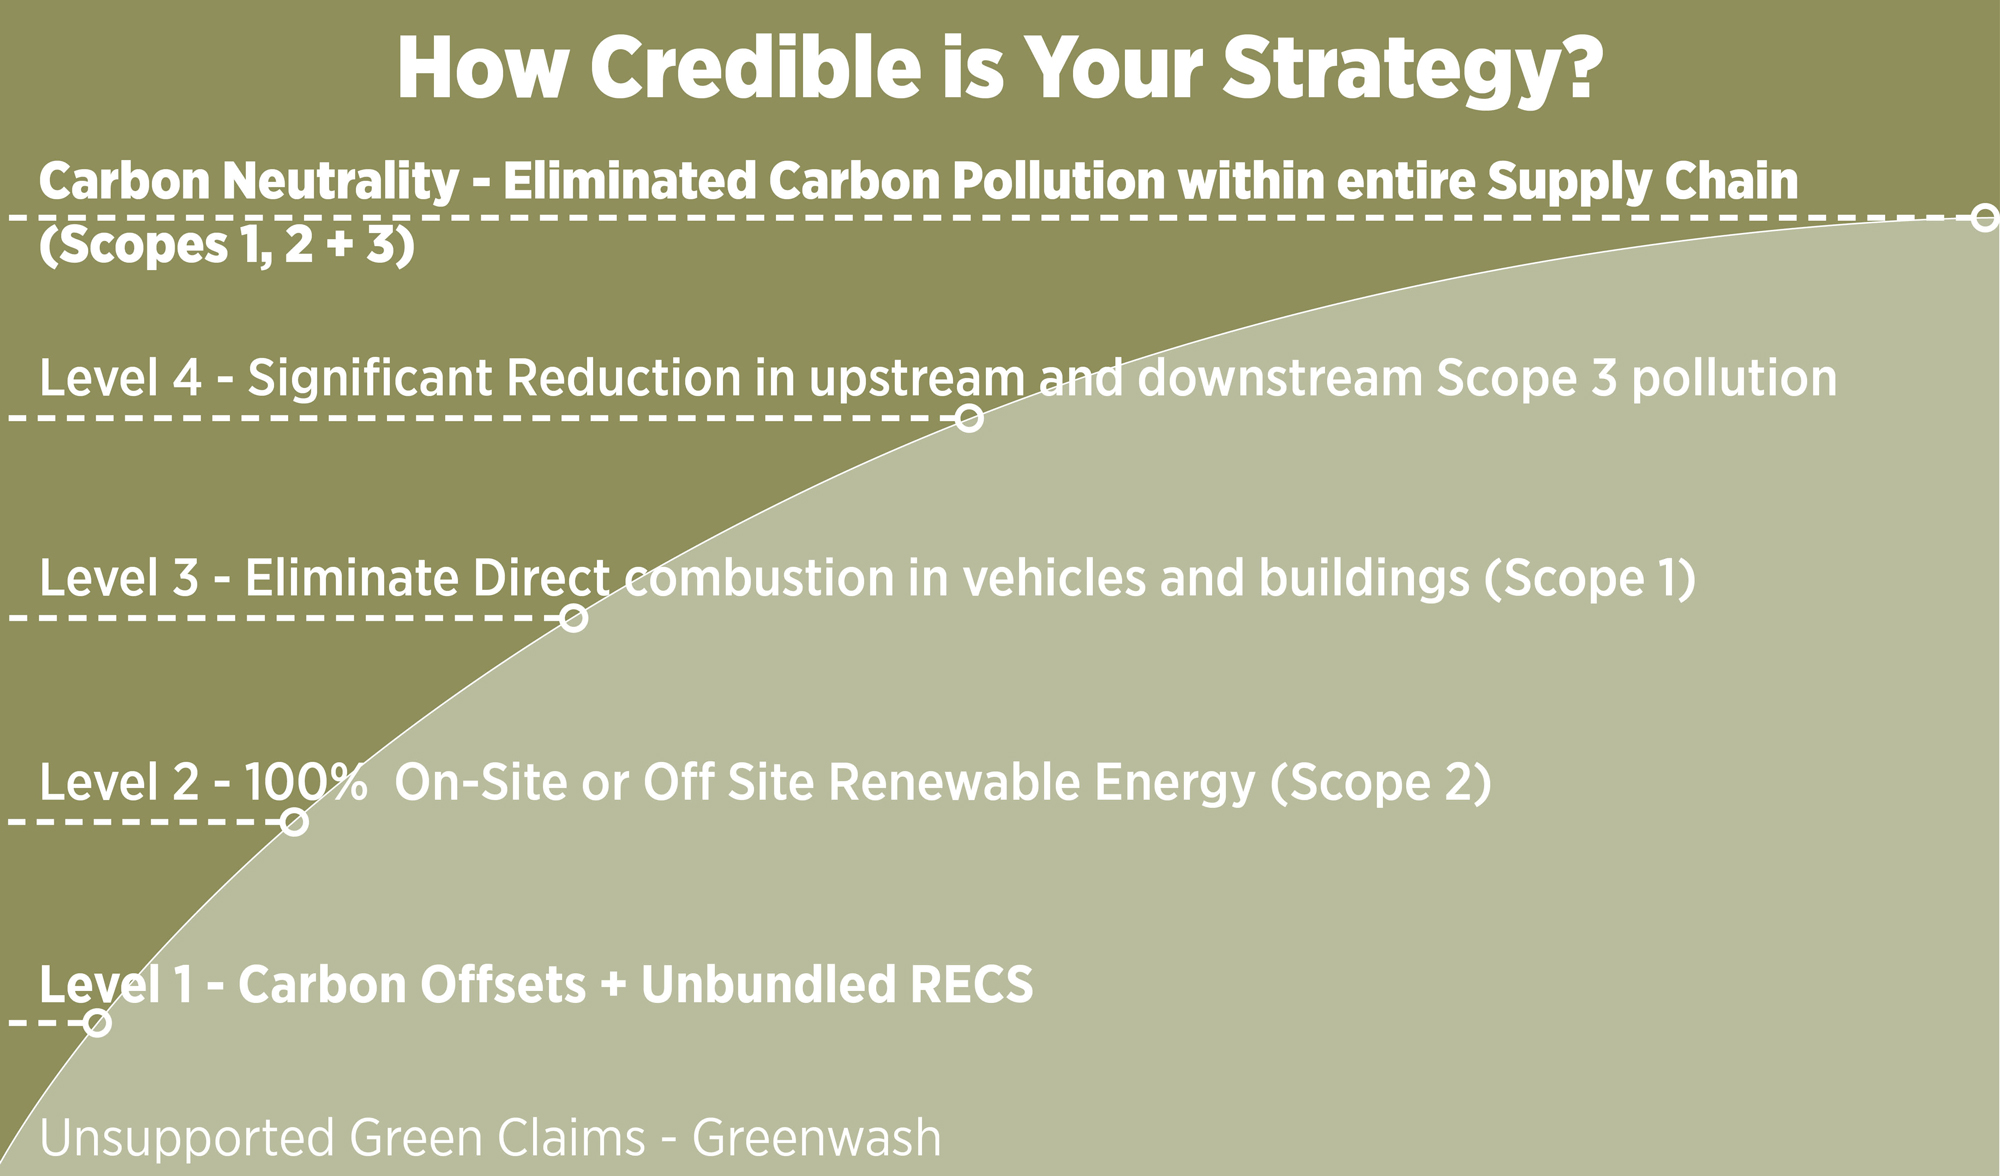
Many companies lay out plans toward carbon neutrality, with varying levels of ambition. This diagram shows increasing levels of action in carbon neutrality plans based on what is common in the industry. Carbon offsets and unbundled RECS (Post 09) represent questionable climate action, eliminating Scope 1 and 2 are mid-tier, and reaching beyond these into upstream and downstream impacts represent the only credible pathway to carbon neutrality.
Note that ESG (Environmental, Social, and Governance) scores are based on disclosure of data, but do not generally score progress or impact. Part of ESG scores may include carbon pollution reporting, but the scores themselves are not good indicators of reduced carbon pollution, lobbying for or against climate regulations, or whether a company is making advanced progress toward goals.
Setting Goals: Carbon Frameworks and Certifications
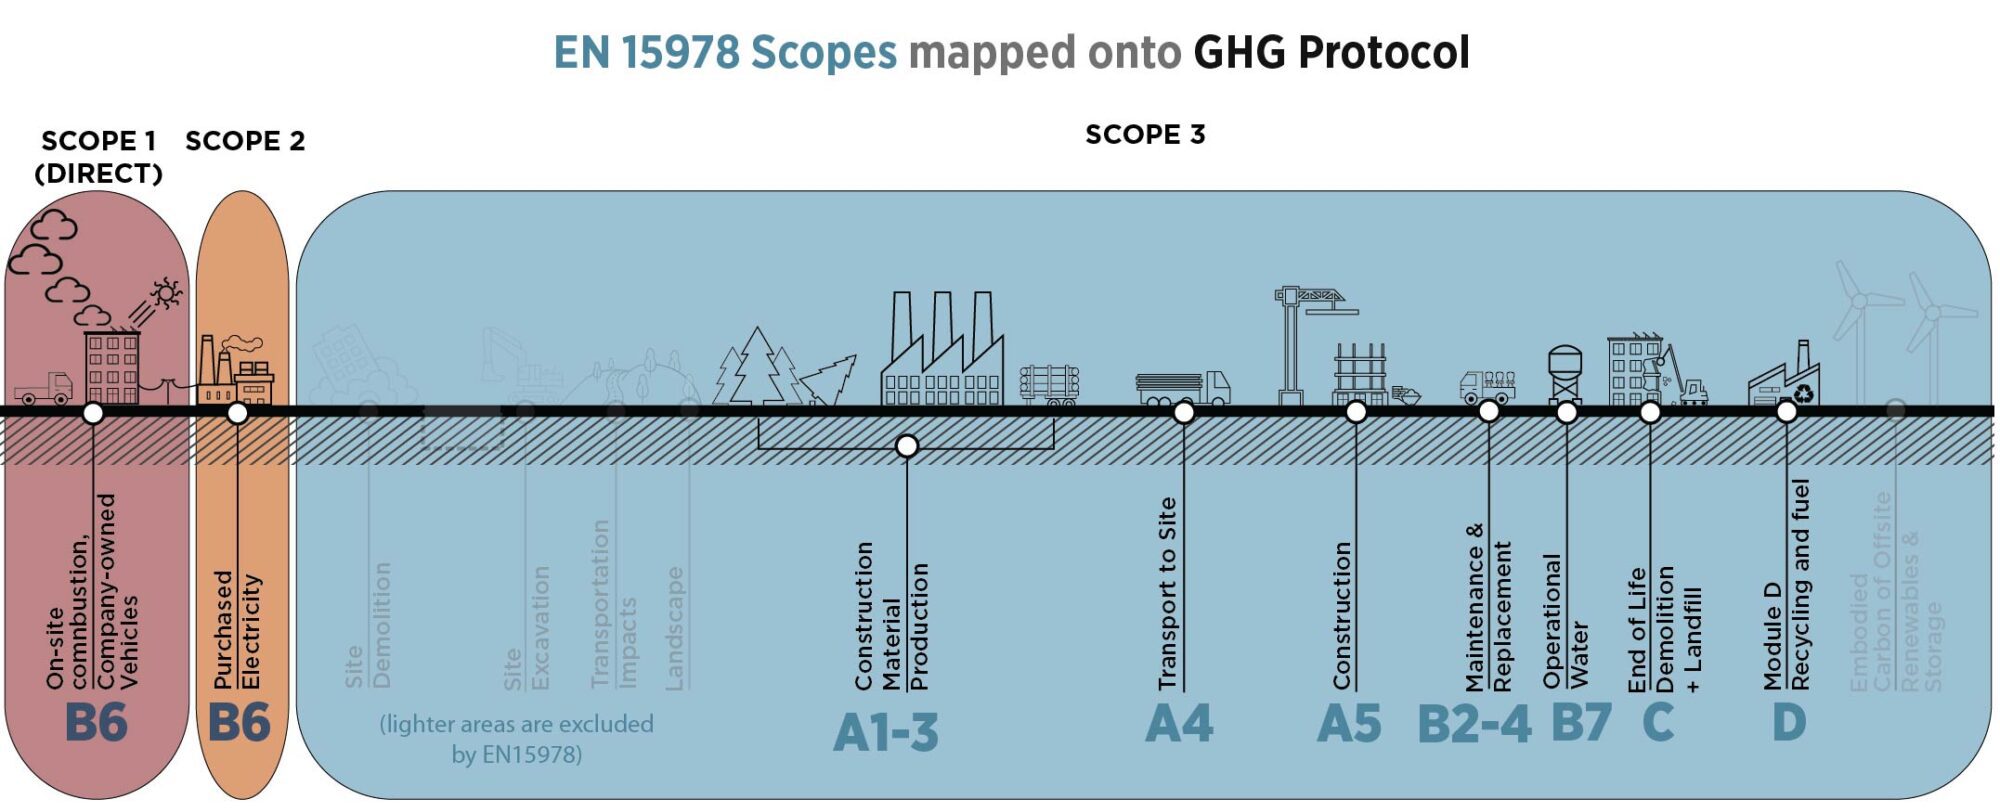
Currently, no frameworks include all pollution, but EN 15978 is the most comprehensive. It includes most energy uses as well as many impacts of construction and construction materials, from product creation through the product’s end of life. Analyses following EN15978 are often referred to as Whole Building Life Cycle Assessment (WBLCA) or, more simply, Life Cycle Assessment (LCA). This scope is organized into several ‘modules’ based on timeframe shown in the graphic above.
- A1-A5: Building Material creation, transportation, and installation on site
- B1-B5: Maintenance and replacement of building materials
- B6-7: Most operational Energy and Water Use carbon pollution
- C1-C4: Material end-of-life, including recycling, landfilling, or others
- D: Optional module showing environmental attributes beyond A-C stages
Most practitioners exclude many of the parts of EN 15978, meaning that while the framework is nearly comprehensive, most analyses done under the framework are not. Additionally, many areas covered by EN15978 don’t have robust data sets, so research efforts or tools like SE2050, MEP2040, NREL Cambium, TM65 (MEP), Pathfinder (Landscape), and GridOptimal are necessary to more thoroughly understand and reduce pollution in these areas. Lastly, EN 15978 is not a certification system, so calculations completed under it are not reviewed by a third party for consistency or minimum standards, making comparisons between projects difficult.
Examples of different frameworks for tracking carbon pollution include:
- EN15978 (described above)
- International Living Future Institute (ILFI) Zero Carbon Certification
- USGBC (LEED) Zero Carbon certification
- ASHRAE 228 “Standard Method of Evaluating Zero Net Energy and Zero Net Carbon Building Performance”
In addition to these frameworks, several other entities have attempted to define the scope of a comprehensive building impact study:
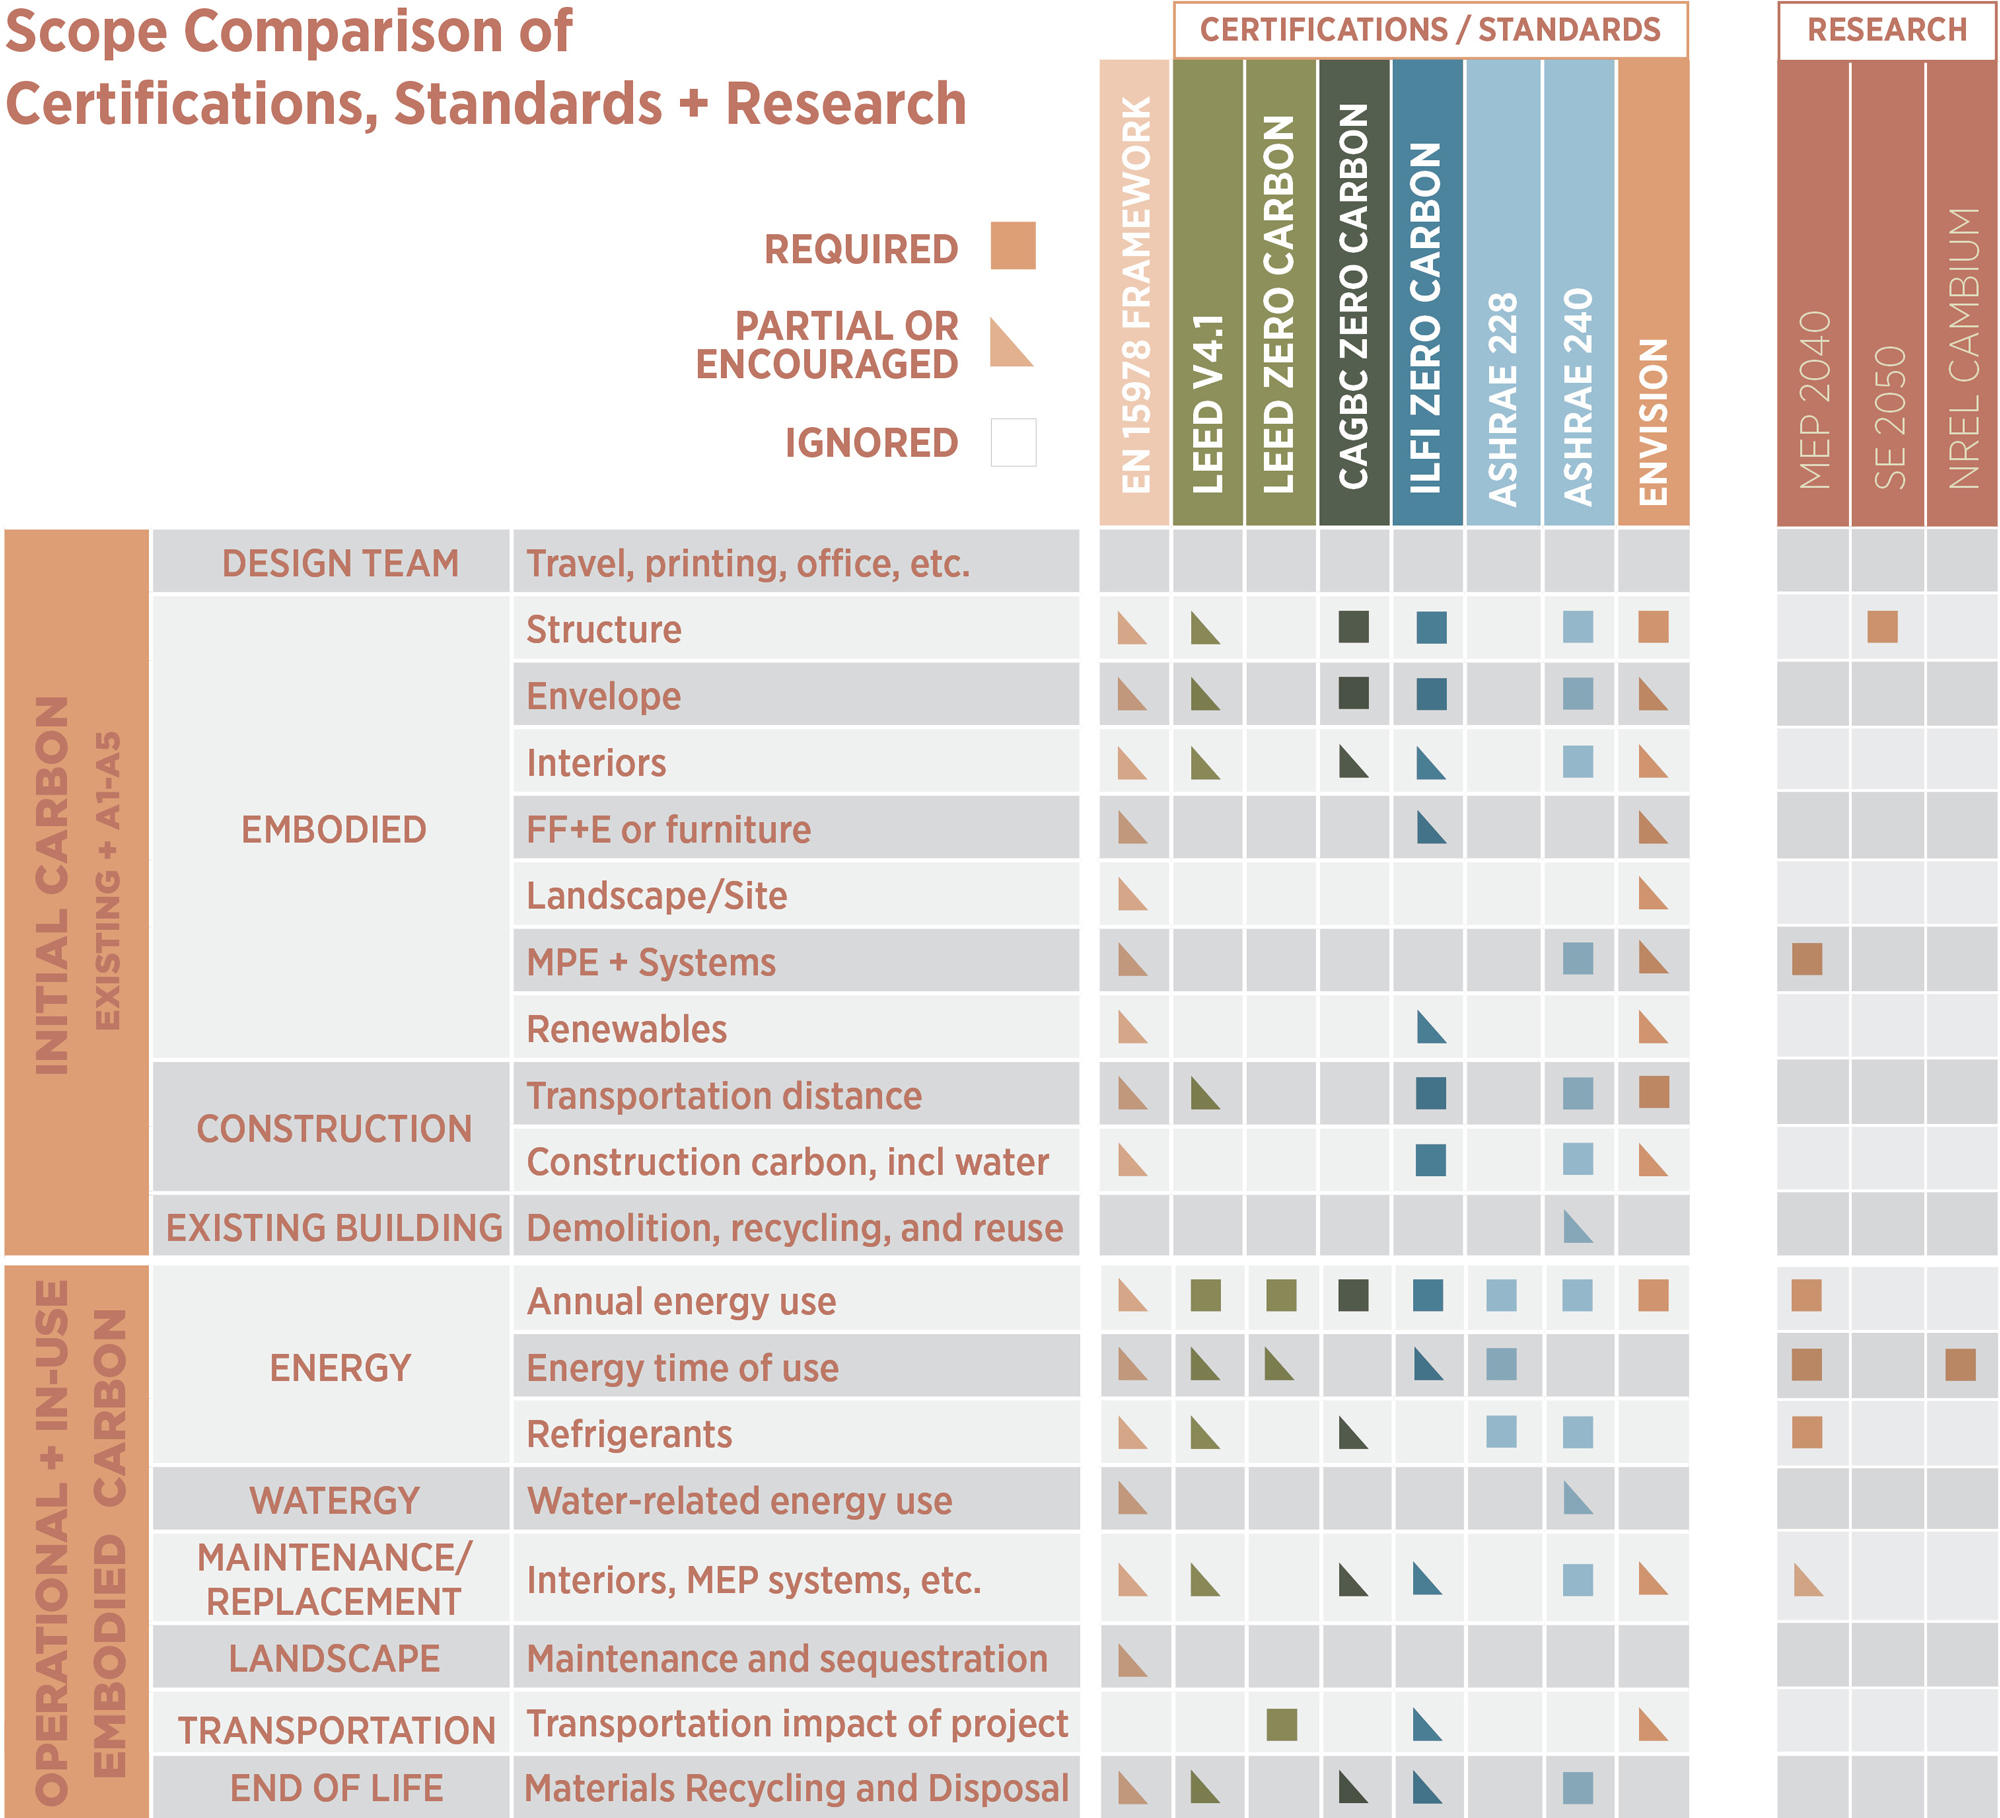
While many frameworks and certifications exist to target carbon pollution, none captures the entire carbon story. Additional research is being performed by different professional groups, however significant gaps in the understanding of total carbon pollution remain.
Commonly Ignored: Consequential Pollution
What are all of the impacts the built environment has on the carbon balance of land and oceans? What level of pollution from the built environment would be carbon neutral with regards to natural systems?
Most carbon accounting is based on attributional emissions (pollution), including EN15978. Attributional emissions are those that are directly associated with a product’s life cycle, within strict boundaries that allow for comparing emissions across similar products. Outside of those boundaries are consequential emission (pollution). They include the consequences of a choice that are outside the system boundaries. For example, installing solar panels on site decreases the transmission and distribution infrastructure upgrades that will be needed, as well as the amount of land needed for the electrification transition (Post 16); while this benefit is not often included in typical attributional studies, it is a real outcome of rooftop solar. Another example is the increasing use of fly ash in concrete to reduce embodied carbon. This provides a small economic incentive for coal-burning that produces fly ash. And with fly ash demand very high to save cost and reduce carbon pollution, using more on one project may mean another uses less in some cases.
While finding all possible consequential emissions is infeasible, ask yourself if there are large sources ignored by your carbon framework. Here are a few that are often large and absent from carbon accounting:
- Transportation impacts of building users based on building site location and design
- Embodied carbon pollution from off-site renewable energy and storage demanded by new buildings
- Carbon pollution from displacement of other activities that occurred on site before demolition of existing buildings. For instance, if a small apartment building is demolished, are emissions increased by residents that now live farther from job centers?
Conclusions
Most carbon pollution is due to the extraction and burning of fossil fuels, and most companies can get close to carbon neutrality by eliminating fossil fuel use directly and within their supply chains. The Greenhouse Gas Protocol provides a commonly-used framework for carbon accounting, and many corporations set goals based on the framework. Unfortunately, most company’s carbon pollution is largely upstream and downstream of their direct control, so engaging suppliers and users is essential, as is engaging in advocacy to change the policies and incentives toward lower-carbon outcomes. No framework considers all carbon pollution, but enough certainty exists to set sophisticated goals and meet them over time.
Please email any questions or comments to Kjell Anderson, kanderson@lmnarchitects.com
Thanks to our external collaborators and peer reviewers
Vincent Martinez, Arch 2030; Tate Walker, OPN Architects; Harry Flamm, Stantec
LMN Architects Team
Huma Timurbanga, Justin Schwartzhoff, Jenn Chen, Chris Savage, Andrew Gustin, Kjell Anderson
Posted: 06/03/2022
Edited: 01/08/2026
The text, images and graphics published here should be credited to LMN Architects unless stated otherwise. Permission to distribute, remix, adapt, and build upon the material in any medium or format for noncommercial purposes is granted as long as attribution is given to LMN Architects.