#embodiedcarbon, #postoccupancy, #research
Tenant Improvements Embodied Carbon Study
1. Executive Summary
How impactful are tenant improvements in the overall embodied carbon story of a building? Using our own office space in the historic Norton Building as a case study, LMN estimated that the sum of multiple interior renovations over 60 years has resulted in embodied carbon emissions comparable to the structure and envelope, perhaps more. Structure and envelope are the most studied aspects of embodied carbon and are written into codes and standards, while interiors embodied carbon are often underrepresented or absent. This study is part of the effort to better understand a more comprehensive carbon picture of our built environment.
2. Goals
LMN began this study in early 2019 with a curiosity about interiors’ impact on whole-building embodied carbon estimates. On average, commercial office interiors renovate every 10 years, with retail and hospitality projects at an even more frequent rate. However, little data existed on the relative importance of Interiors in designing for Zero Carbon, especially given the cyclical nature of renovations. With the overarching goal of creating carbon balanced buildings and sites, we set out to quantify the significance of total interior embodied impact over the lifespan of a building.
Since we have first-hand knowledge of the quantities and materials specified in our office’s most recent 2013-2015 remodel, we chose our own office for this case study. To incorporate the cyclical nature of renovations, we included all past renovations in our spaces since it was first located to the Norton Building in 1984. Furthermore, we extended the study timeframe back to when the building opened in 1959, thus providing the context of a whole building life cycle across 60 years.
3. Process
The Carbon Leadership Forum embodied carbon TI study and calculator published in 2019 provided a springboard for this study. We began with their TI LCA calculator as a template, customizing it to include multiple renovations then inserted EPD information specific to the materials and finishes of our office renovations. Enough EPDs existed at the time of study to make reasonable estimates of embodied carbon for most of the Interior materials.
Step 1 – Assess the Scope of Each Remodel
Using archive documents from 1984 as well as staff interviews, the team determined that there were six renovations of various demo and new construction scope associated with our office space as of 2019. These included:
- 1 Bathroom remodel 2009
- 3 Major office space renovations 1995, 2000, and 2013
- 1 Glazing replacement of the building 2000 (2)
- 2 Additional partial floors renovated 1997 and 2015
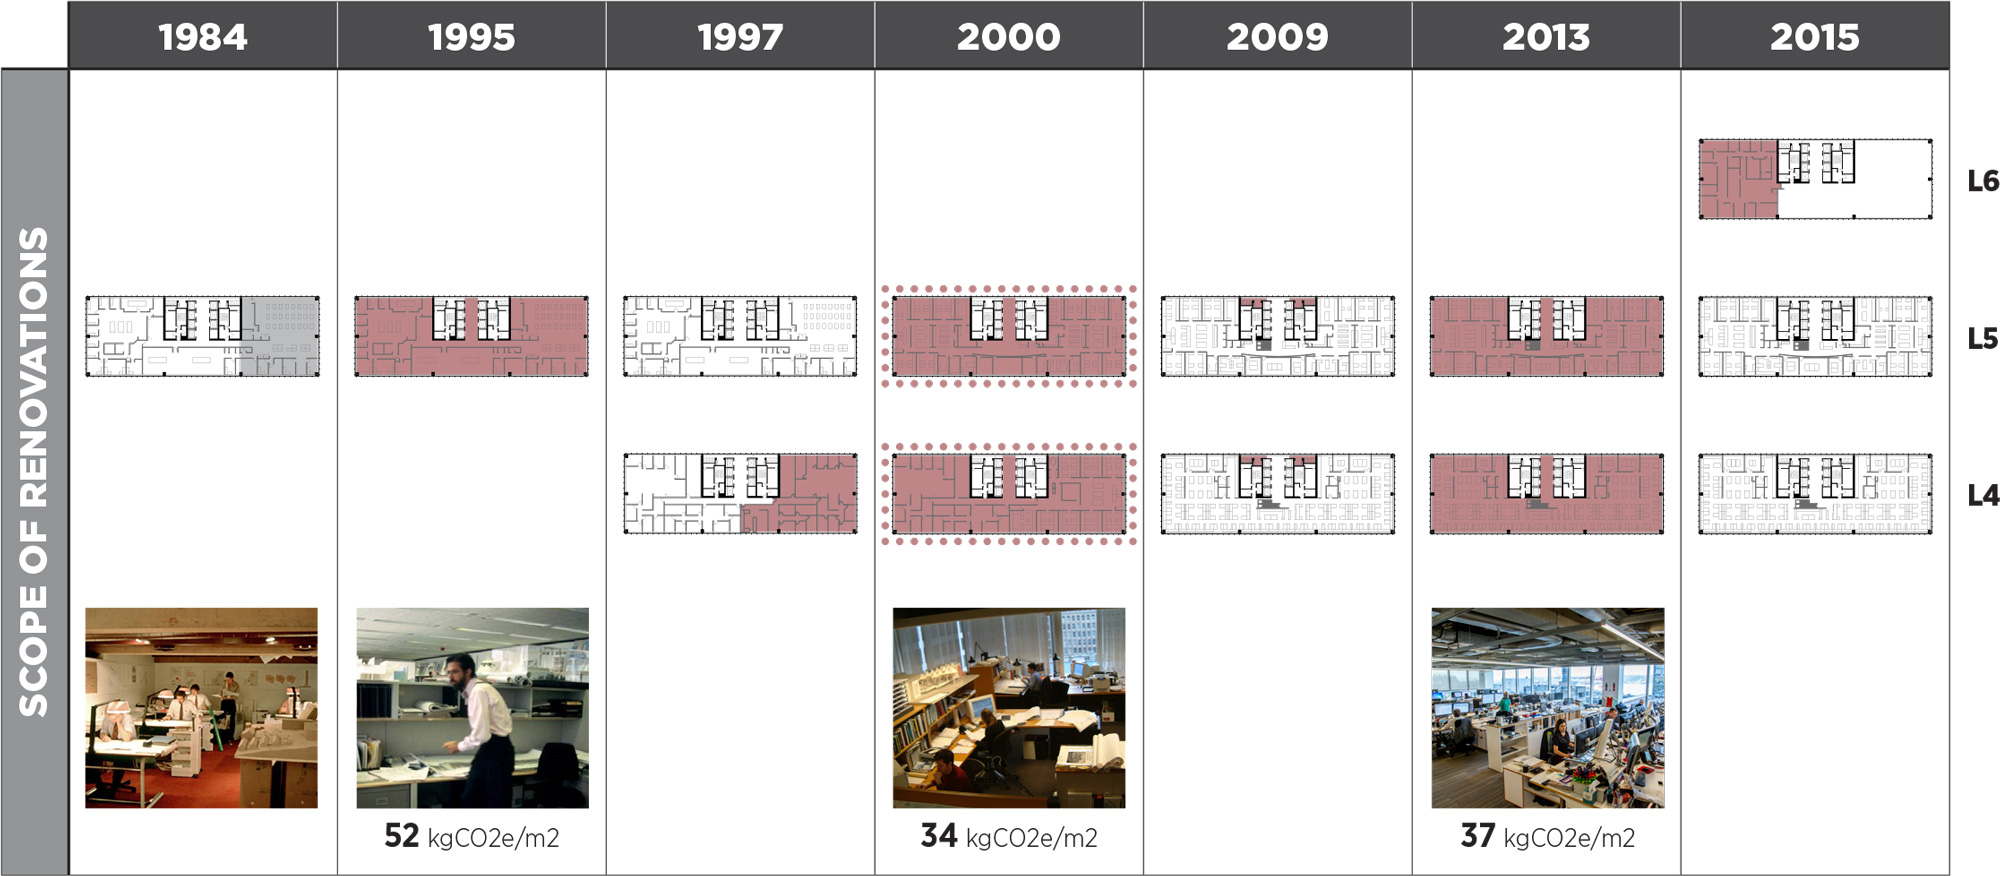
Figure 1 - The diagram illustrates the LMN office demolition and construction through three major renovations at an average of every 9 years, consistent with the assumption that workplace goes through renovations every 10 years.
Beyond these main remodels, there was additional temporary work on other floors to accommodate staff displaced by the remodels. However, these were excluded as the drawings were unclear as to what was new or reused within those remodels. Some of the furniture was likely existing in-place and not remodeled or was relocated to the temporary space without significant embodied carbon emissions.
Using the drawings and specifications for the remodels, takeoffs were done using floor plans as well as elevations of walls and furniture. Some assumptions had to be made due to lack of specification information, such as the thickness of interior glass or cabinetry details. Interestingly, the 1959 building was designed with reconfigurable metal partitions with the intent to avoid the cost and waste associated with remodels (3), however, none of these original partitions remains today and it is unclear when these were removed from each tenant space.
Step 2 – Determine Study Scope
The past remodels brought up several questions that the team needed to address to move forward with the analysis.
- What major building components should we include?
Structure, envelope, interior finishes and materials and furniture were generally included, while MEP systems, including lighting, were excluded due to a lack of embodied carbon data available at the time of study. Note that the original ductwork is still being used in LMN’s office area, with modifications only for new conference rooms. Office equipment was also excluded. - Which interior product categories should we include?
Carpet, resilient floor, partition assemblies, furniture, custom display tables, ceilings, paint, acoustic wall panels, interior glazing, and doors were included. [See Figure 7] Items excluded due to a lack of data were window treatments, miscellaneous ancillary furniture, some miscellaneous trims, and wall bases. - How should we address items that were used before EPDs became available?
We used similar product’s EPDs available at the time of the study to estimate the embodied carbon for past materials. Product specific EPDs were preferred and used where available but we relied on Industry Average EPDs if no product specific EPDs were available. - How should we address items that have limited EPDs even at the time of the study (such as furniture)?
Take off was done for the equivalent of total MDF volume that goes into each workstation. This quantify was then paired with Industry Average EPD for MDFs to capture at least part of the environmental impact known to be associated with workstations. - What Life Cycle Stages should we use?
Originally the team set up to estimate A1-A3 for all new items plus appropriate C or D items for demolition. However, C and D were eventually not considered since the end of life for most items could not be reasonably determined. Module B items were excluded as they are relatively small in most cases, and some B elements are the focus of the study (replacement cycles) as well as because they are not as universally available as A. Interviews suggested that there were no significant repairs or replacements between remodels.
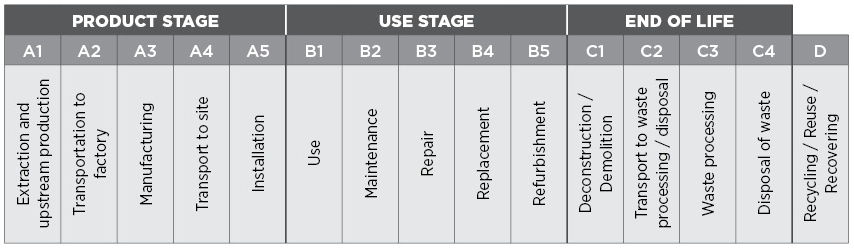
Figure 2 - This study include A1-A3 data from EPDs. Other modules were excluded.
- How should we calculate the original structure and envelope?
The original structure is steel columns with pre-stressed concrete long-span beams. The asymmetrically located core is concrete, with some CMU used. For the building structure and envelope, a Tally model was used, including A1-A4, B2-B5, and C and D modules. - How should we account for different total leased area over the 30+/-year period?
We normalized all the embodied carbon across 2.4 floors, which was our rental in 2019. This means that when we only leased one floor, we multiplied any embodied carbon x2.4 to account for the other rented floors likely being renovated by other tenants on a similar time scale. As we leased more space, we used other multipliers to normalize it at 2.4. We also normalized the whole-building structural and envelope embodied carbon across 2.4 floors, though we did not include the parking garage in this calculation. - Should we include non-office spaces that support LMN work?
We excluded support spaces such as our fabrication shop, shared bike storage, shared showers, building lobby, and loading dock. While the shop is LMN-specific, it has had many evolutions and has generally been leased without significant architectural modifications. - How should we show embodied carbon results over time?
To show the results more clearly, renovations were bundled into 5-year periods (ie, 1995-1999) for the Embodied Carbon Timeline graphic. This allows each 5-year bundle to show included structure, envelope, and interiors scope. - How do we account for furniture?
Furniture EPDs are scarce. Since our workstations are almost entirely wood and laminate, we included both of these items based on take-offs and available EPDs. From the few furniture EPDs available we found that the amount of steel appeared to be the main driver for GWP. Our 280 kgCO2e/workstation is significantly lower than the EPD used for the CLF TI study (Allsteel Cadence), which reports 1,100 kgCO2e/workstation. However, the CLF TI workstation includes 228 kg of steel/unit, while ours roughly 10x less.
Step 3 – Crunch the Numbers
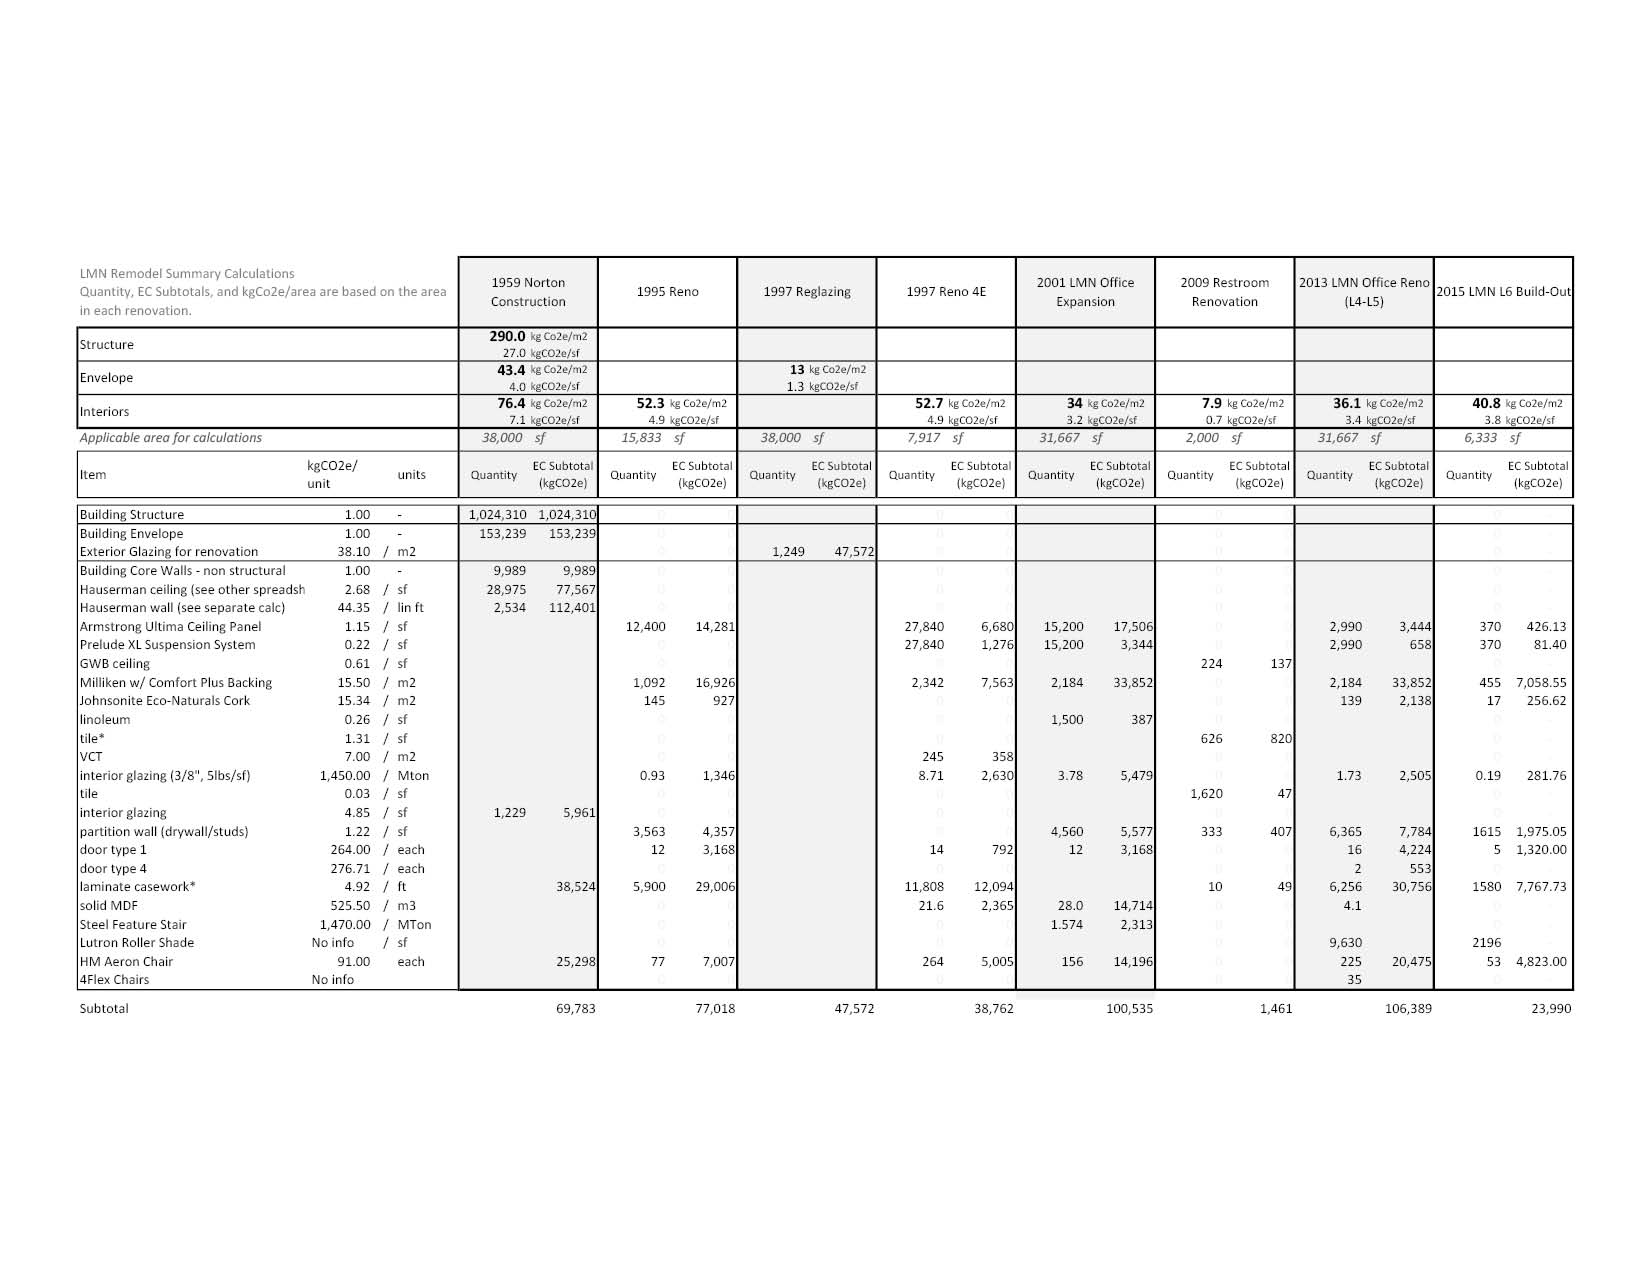
We gathered modern EPDs for materials used the renovation, using product specific EPDs where available, or industry average EPDs where they were not available. We inserted the Global Warming Potential (GWP, expressed in kgCo2e) for each material in the CLF TI calculator and multiplied by the quantity (basd on each Product Category Rule measurement). (4) We added many rows, and overrode the calculator’s data in nearly all cases since we had product-specific EPD data. This yielded the sum, or total embodied carbon impact of each renovation, as well as the sum of embodied carbon of all renovations during the period our office occupied the Norton Building. The numerical results are in Figure 7 and 8.
4. The Results
The initial results from the data show that our office renovations have had a significant impact on the measured whole building embodied carbon over the 35 years LMN occupied the Norton Building based on the available data.
- We then modified the data in two ways to better understand how we can project it forward:
We assumed at least one additional remodel would have occurred between when Norton Building was first occupied in 1959 and prior to LMN moving in 1984. This is a conservative assumption since this is a span of 25 years and would likely include two renovations based on our assumption of 10 year renovation cycles. - If the building was built today, we would include a 30% embodied carbon reduction in concrete structure which is achievable with modern concrete mixes and technology advancement.
With these two overlays, the Interiors embodied carbon is projected to be higher than structure and envelope combined over 60 years.
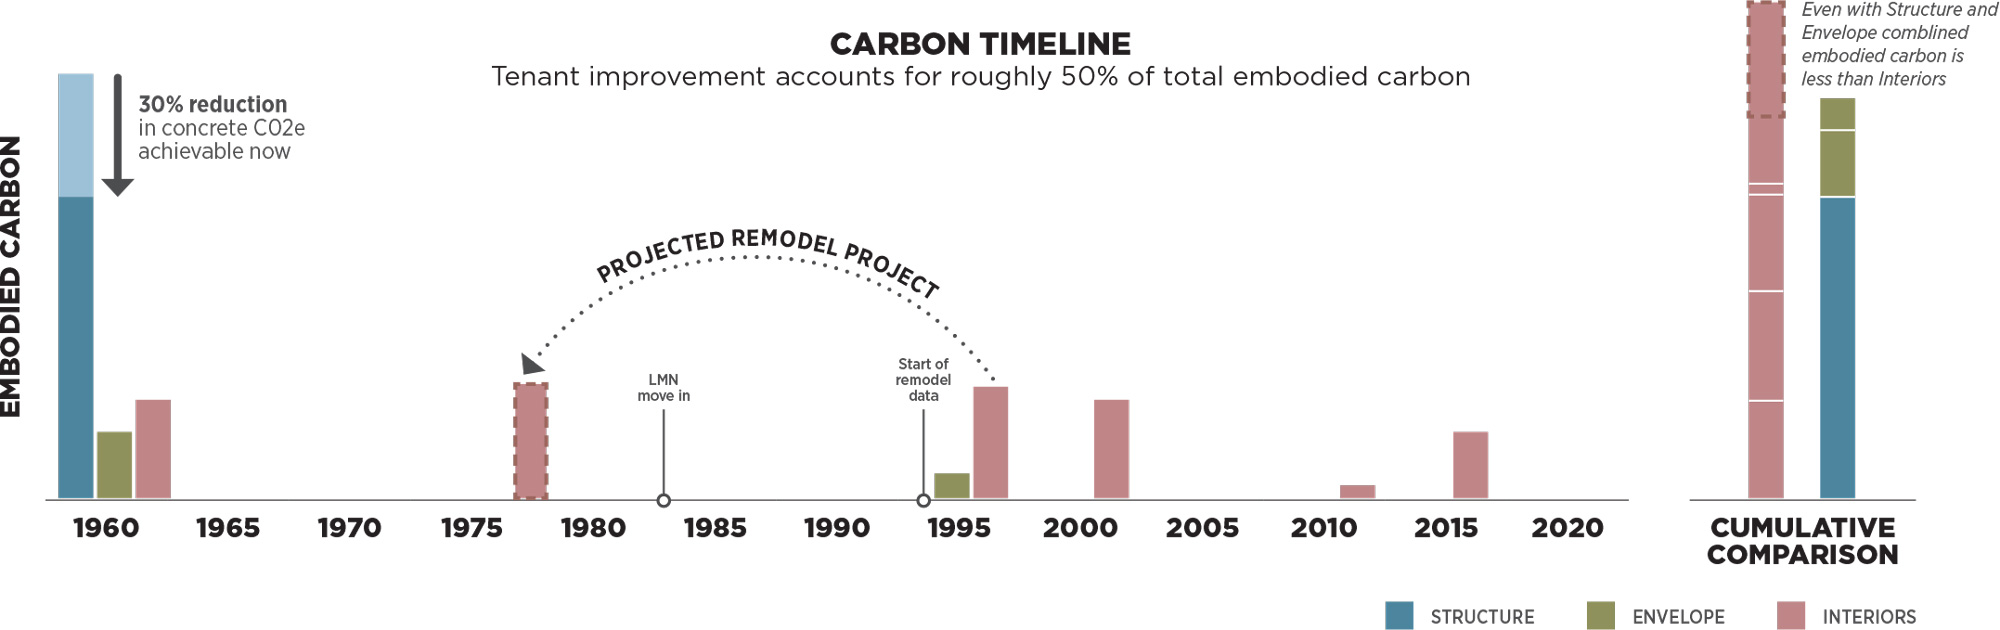
Figure 3 - Separating the results of the study into Structure, Envelope, and Interiors, arranged in 5-year segments. This scenario supposes that an additional remodel happened, equal to the 1995 remodel in embodied carbon, halfway between 1960 and 1995 as is a fairly conservative estimate. It also takes into account the 30% reduction in concrete embodied carbon that we can realize on nearly all projects today. The results estimates that the embodied carbon of the Interiors portion is higher than the combined impact of Structure and Envelope over 60 years. For calculations, see Figure 8.
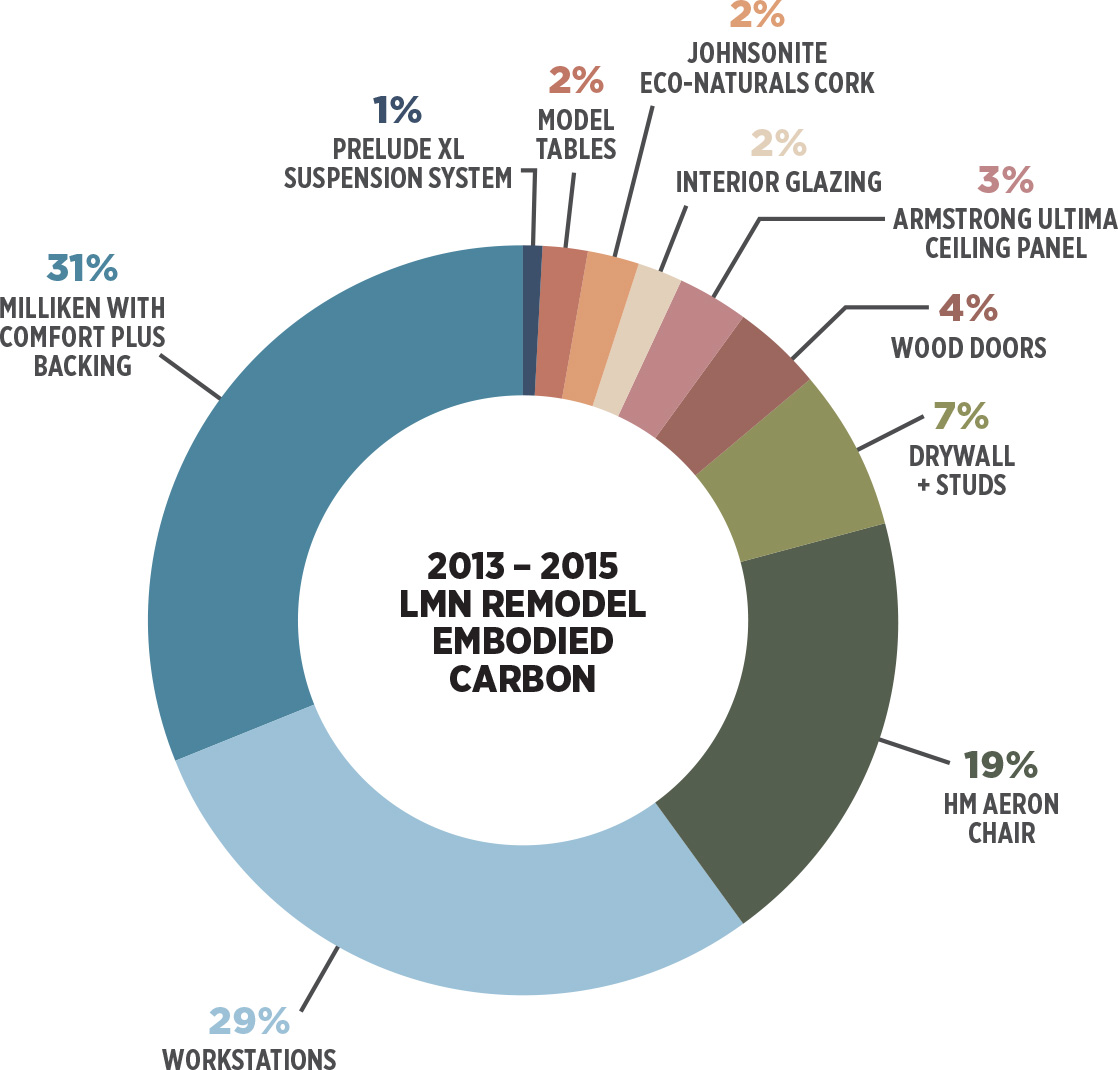
Figure 4 - Interiors Embodied Carbon pie chart of the 2013-2015 Remodel
Is this Result Indicative of Other TIs?
We think yes! Over the 30+ years LMN has determined when and how to renovate based on changes in functional needs and culture shifts at a frequency not unlike other office spaces. In fact, we are likely showing less embodied carbon than other TIs since we have a relatively minimal palette with an increasingly open office (there are no enclosed offices), and our 2013-5 renovation is open to structure in our open office areas, using existing Unistrut system for lighting support in lieu of acoustic ceiling panels. If the study included product categories currently excluded due to lack of clear quantity or EPDs (such as lighting, trims, etc.), the total impact of Tis would increase. For these reasons, we believe the data we show is a relatively conservative reflection of the impact of cyclical renovations.
Our results align with the CLF TI study(5), showing 36-52 kgCO2e/m2 of impact per remodel, aligning with the CLF low (45) Impact findings. The lack of private offices and reuse of some spaces likely reduced the embodied carbon to well below the medium (90) and high (135) scenarios in the CLF TI study
5. Moving the Industry Forward
We need clearer and more easily comparable environmental impact data, and we need more products covered.
- While EPDs provide us with environmental impact data, complications remain. EPDs are not always comparable apples to apples when trying to compare two similar products within the same product category, due to inconsistencies in product category rules, unit of measurement discrepancy, and which life cycle stages are included. In presenting this data at Greenbuild 2019, we gave attendees evaluate several EPDs for one product type (either carpets or chairs) to compare GWP information. This resulted in a variety of conclusions on what the preferable product from an embodied carbon standpoint would be. The now more widely available EC3 tool (buildingtransparency.org) makes the data more easily comparable as it equalizes the EPD data. EC3 is a more approachable tool to use in place of analyzing raw data from EPDs.
- Furniture and Chair EPDs are scarce, yet they is one of the most Embodied Carbon intensive product categories in an interior space according to our study. Finding and comparing the embodied carbon of furniture is difficult, however, it is possible to arrive at a number by breaking down known materials used for the furniture and calculating its area or volume. Many leading furniture companies are working on creating more EPDs for their products, and Architects and Designers should continue to request EPDs in our Specifications to make sure this product category is captured in the embodied carbon conversation.
Interiors Scope needs to be included in Whole Building Life Cycle Analysis.
- When measured over time, interiors embodied carbon impact can be as significant, if not more, than structure and envelope. Normal Whole Building Life Cycle Analysis (WBLCA) should include the whole building, including Interior scope, to accurately assess the total embodied carbon impact of a building throughout its lifetime. (6)
- Tools such as EC3, Athena, Tally, and others need to include products and product categories that reflect interiors scope. In addition to customizing CLF’s TI Calculator used in this study, currently there are few tools to help integrate interior scope into WBLCA. Tally can include high level interior scope and customizing replacement and maintenance cycles to better reflect the turnover of interior renovations yields a more complete story about the overall interior’s impact over time. EC3 (buildingtransparency.org) is another great tool to help normalize EPD information when comparing materials. It also has the function to compare two material palette scenarios to know how material decisions change the embodied carbon impact of the project.
- Building Certifications and Standards need to catch up. ILFI and LEED can better integrate interiors’ work into their rating systems to get a more holistic view of carbon, including Interiors’ scope.
- A circular economy considers buildings as an investment of carbon, allowing future projects to reuse the carbon instead of landfilling it and creating new pr0oduicts from virgin materials. In this mindset, how do we consider the future ability to reuse the carbon emissions from interior materials? If a chair can be easily fixed, with parts and skills available to do so, how is this considered in an EPD? If a material can be demounted and is very likely to be reused, how is this considered? How does our industry consider materials that are longer-lasting, demountable, reusable, repairable, and part of a functioning circular economy?
- How does our industry consider designs that may last longer than others? Circularity is key to reducing embodied carbon in addition to minimizing palettes and choosing low embodied carbon products. Concepts such as “Screw, not glues (7)” makes a product inherently more easily reused and in turn, less carbon wasted. Our industry needs to develop a metric for circularity to track how much carbon is eliminated.
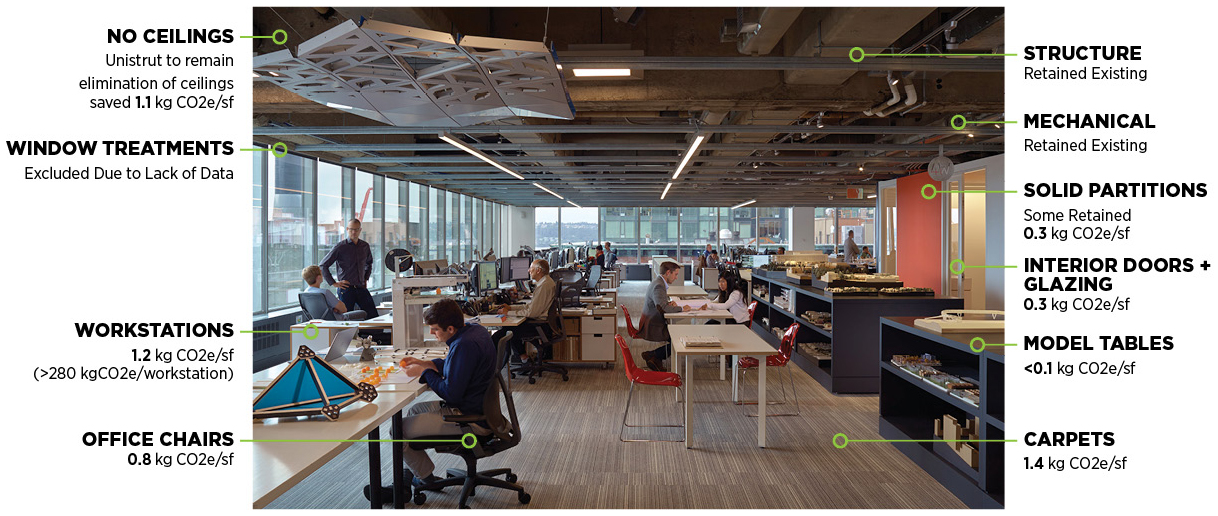
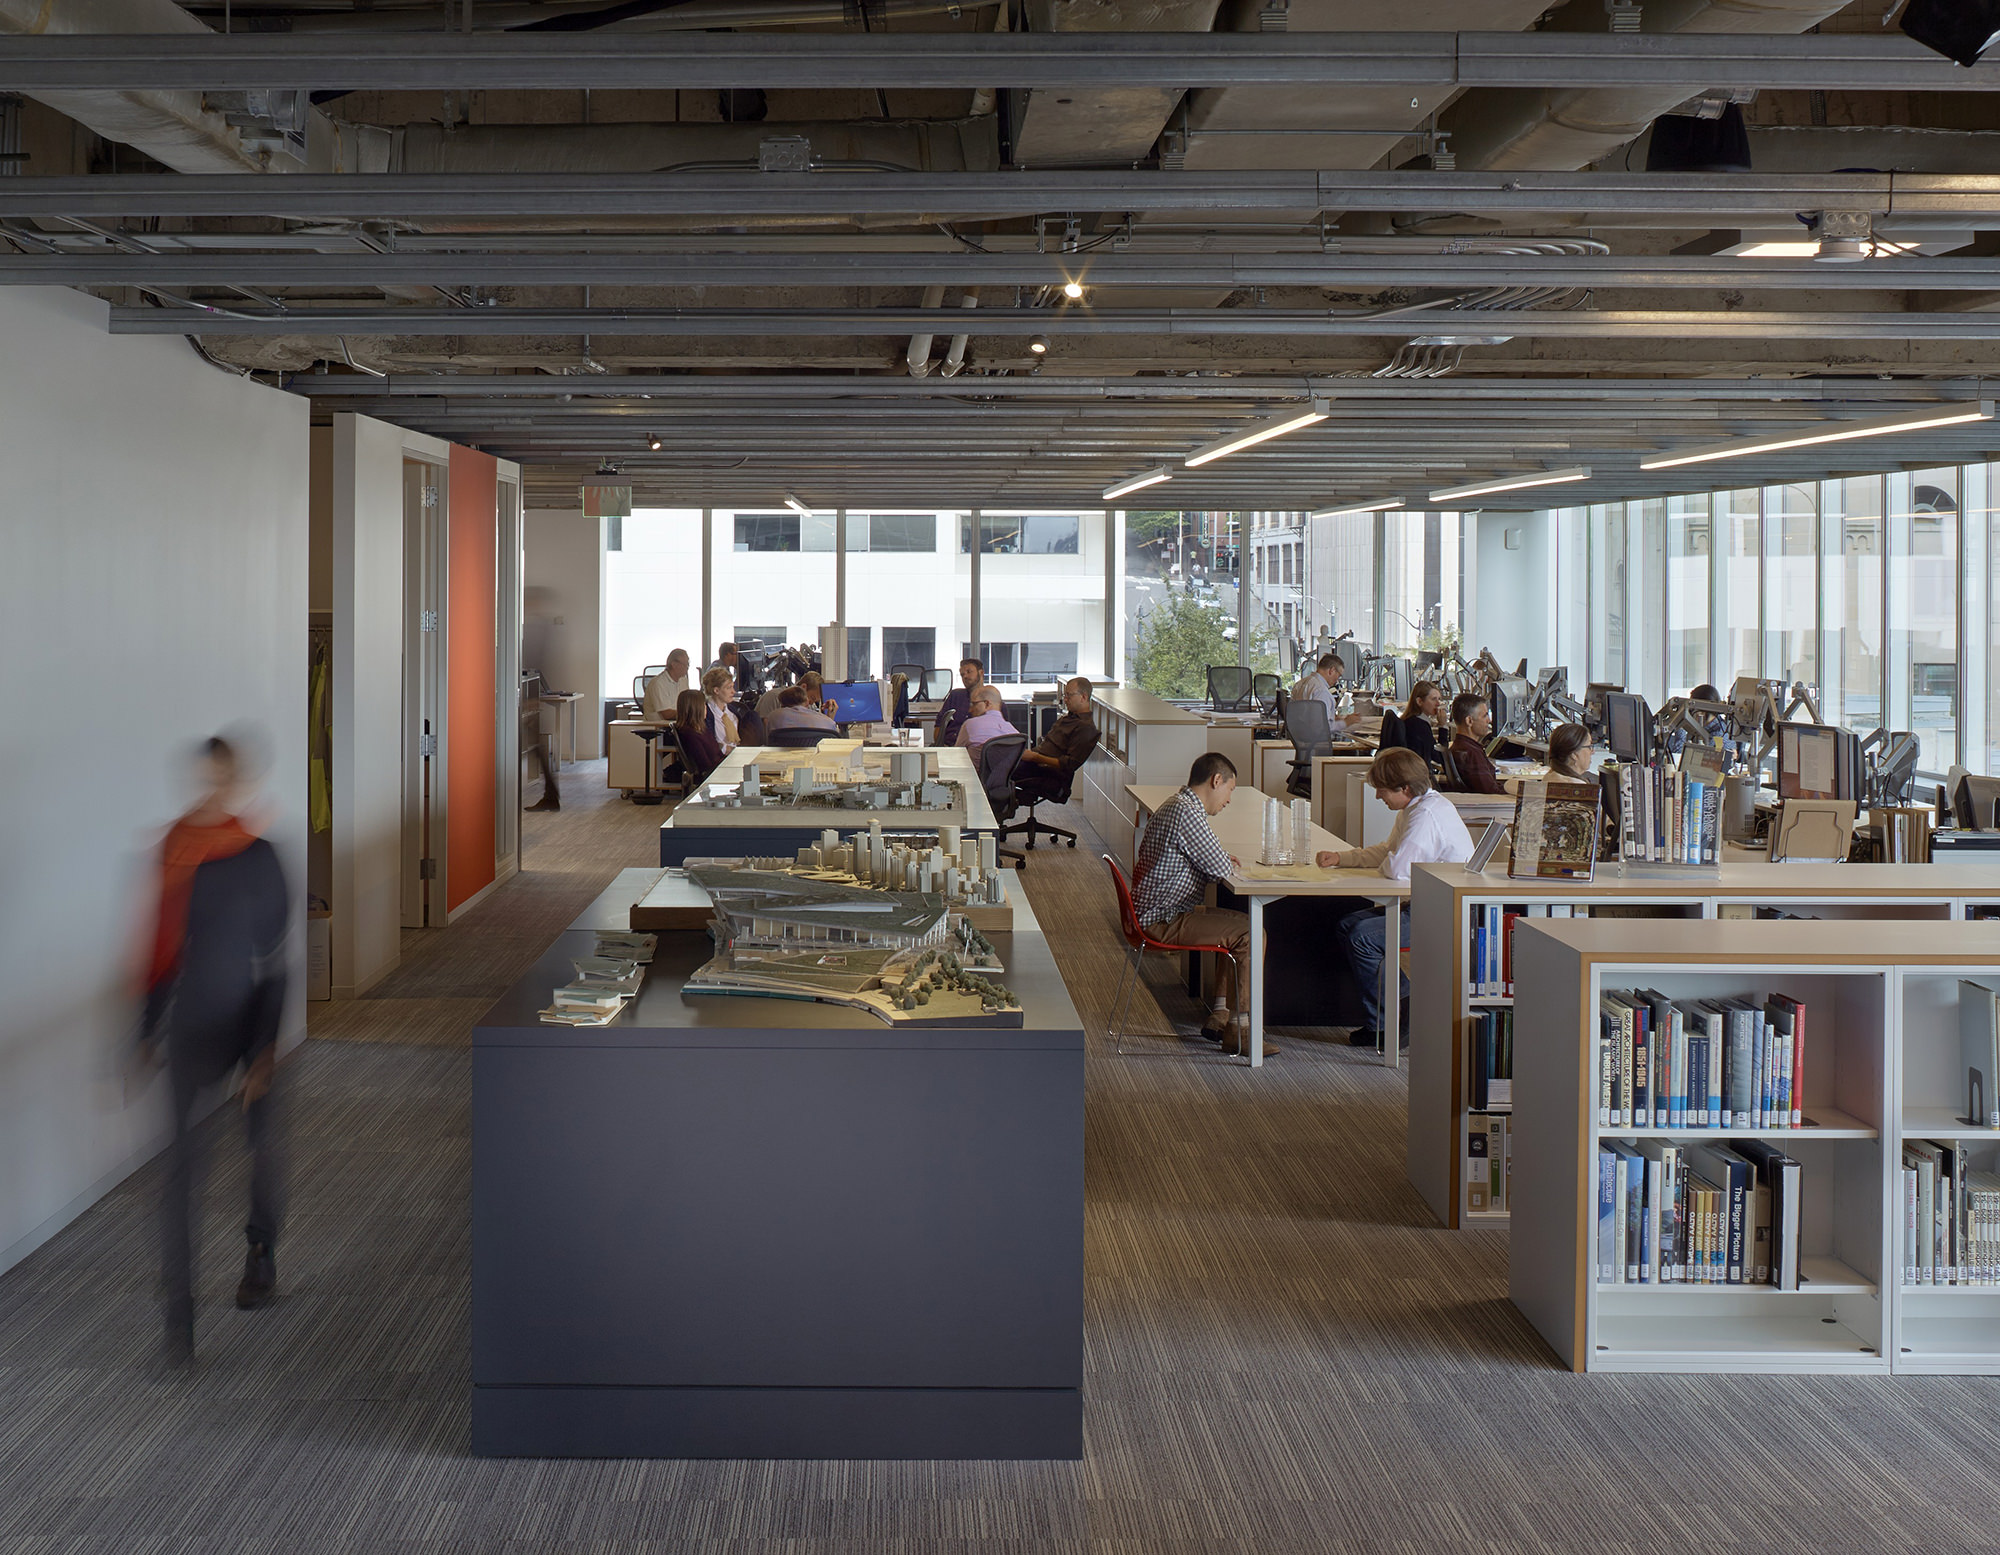
Figure 5 Image of LMN’s office showing the embodied carbon impact of the various major elements.
AGGRESSIVE CARBON REDUCTION IS ACHIEVABLE NOW!
Looking at the breakdown of products for just the 2014-5 remodels, the chairs, carpet, and workstations comprise over 75% of the total embodied carbon, shown in the middle column. The left column imagines if we had acoustic ceilings throughout the space instead of open-to-structure. The right column shows the significant reduction possible by aggressively pursuing embodied carbon reductions with high-quality, similar-performance products on the market in 2021. Overlaying these interiors reductions on the original graph and comparing to structure and envelope reduces the relative importance of interiors but does not include all the advancements in reducing embodied carbon across other sectors. This study has not looked at what an optimized whole building could be.
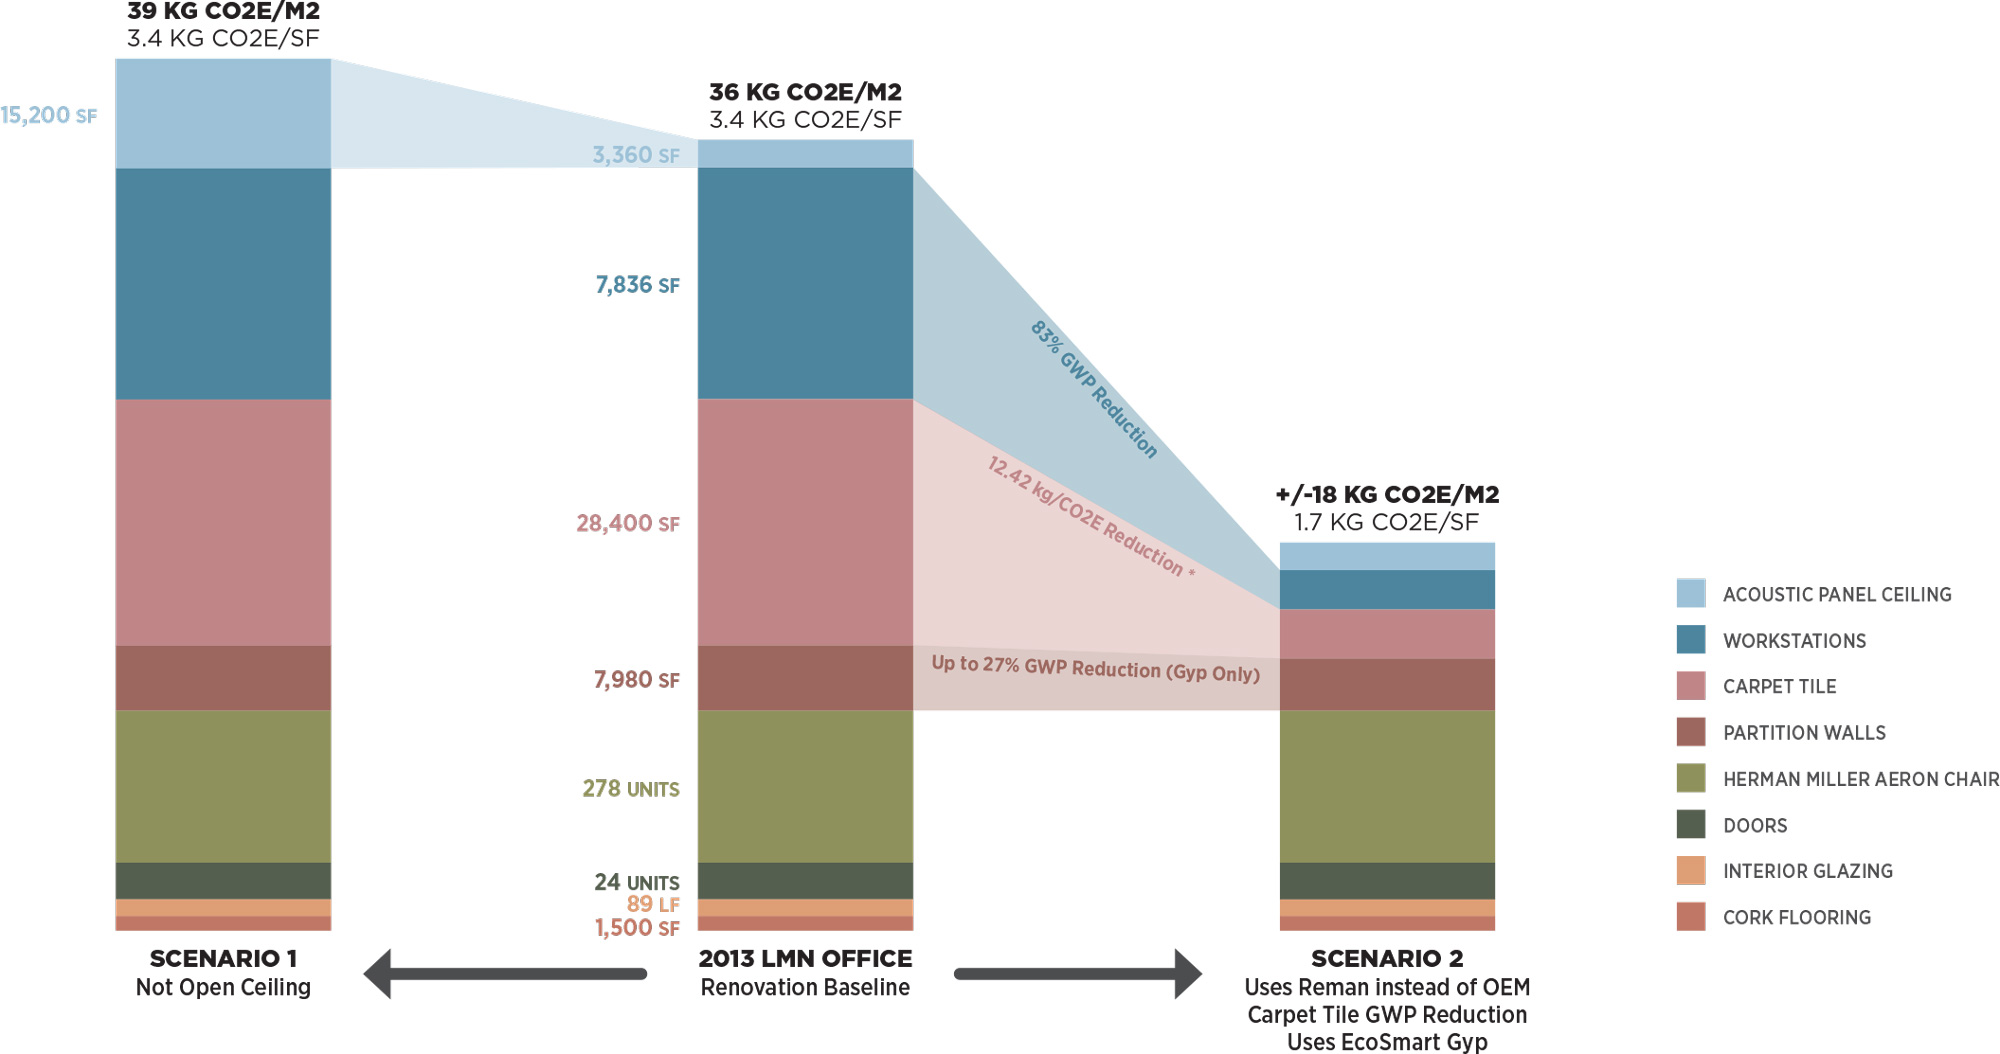
Figure 6 - LMN’s Office remodel Embodied Carbon in three scenarios
UNDERLYING CALCULATIONS
While a more complicated spreadsheet was used to perform the calculations, this is a direct output of the numbers contained there. For a deeper look at the raw data, please email Jenn Chen jchenn@lmnarchitects.com or Kjell Anderson kanderson@lmnarchitects.com

- carbonleadershipforum.org/lca-of-mep-systems-and-tenant-improvements/
- The glazing was replaced in 2000, although the aluminum mullions were reused. This meant that the embodied carbon emissions associated with the re-glazing was minimal compared to glazing systems for new buildings.
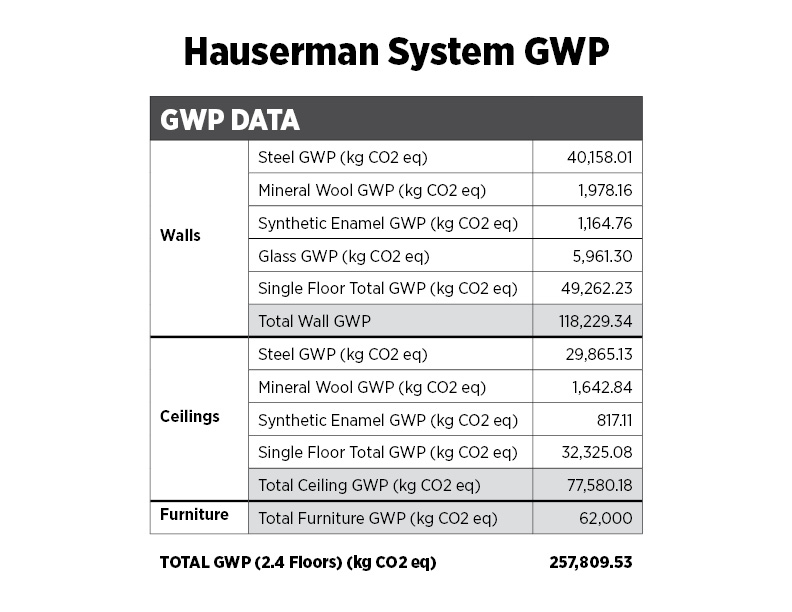
- Designed by by Skidmore Ownings and Merrill, construction was completed in 1959 on the Norton Building. The original metal-clad interior partitions were adjustable, fitting into a ceiling grid, offering inexpensive and embodied-carbon-free remodels. LMN did sub-let one quarter floor during the 2015 remodel that still contained these original partitions. Based on recollection and some blurry photos, this appeared to be very similar to ‘Masterwalls moveable partitions by Hauserman’ which aligned with a reference building management made to Hauserman walls during an interview. A 1938 catalog was available via internet in 2019 here: https://archive.org/details/Sweets1938Sec202MasterwallsByHauserman and this was used as the basis for an embodied carbon estimate of the original building’s partition system.
- Soon we will be able to use the EC3 tool to normalize the GWP data for each EPD based on data confidence, but for interior materials this was not available at the time of the study.
- https://carbonleadershipforum.org/lca-of-mep-systems-and-tenant-improvements/
- Whole Building Life Cycle Analysis should include Structure, Envelope, Interiors, MEP, and Landscape/Sitework.
- 3XN Architects / GXN Innovation, Building a Circular Future, 3rd Edition – 2019
Permission to distribute, remix, adapt, and build upon the material in any medium or format for noncommercial purposes is granted as long as attribution is given to LMN Architects.