#pathtozerocarbon, #sustainability
07 – Embodied Carbon 101
When we think of our carbon footprint, we tend to consider the emissions from electricity and gas we use to heat our buildings or to cook our meals. Until recently, nearly everyone overlooked the greenhouse gas emissions spent to create, transport, maintain, and dispose or recycle building materials. The impacts of building materials on climate change are commonly referred to as ‘embodied carbon.’ In this article, we’ll explain what embodied carbon is, how it’s measured, and how design teams can best approach reductions.
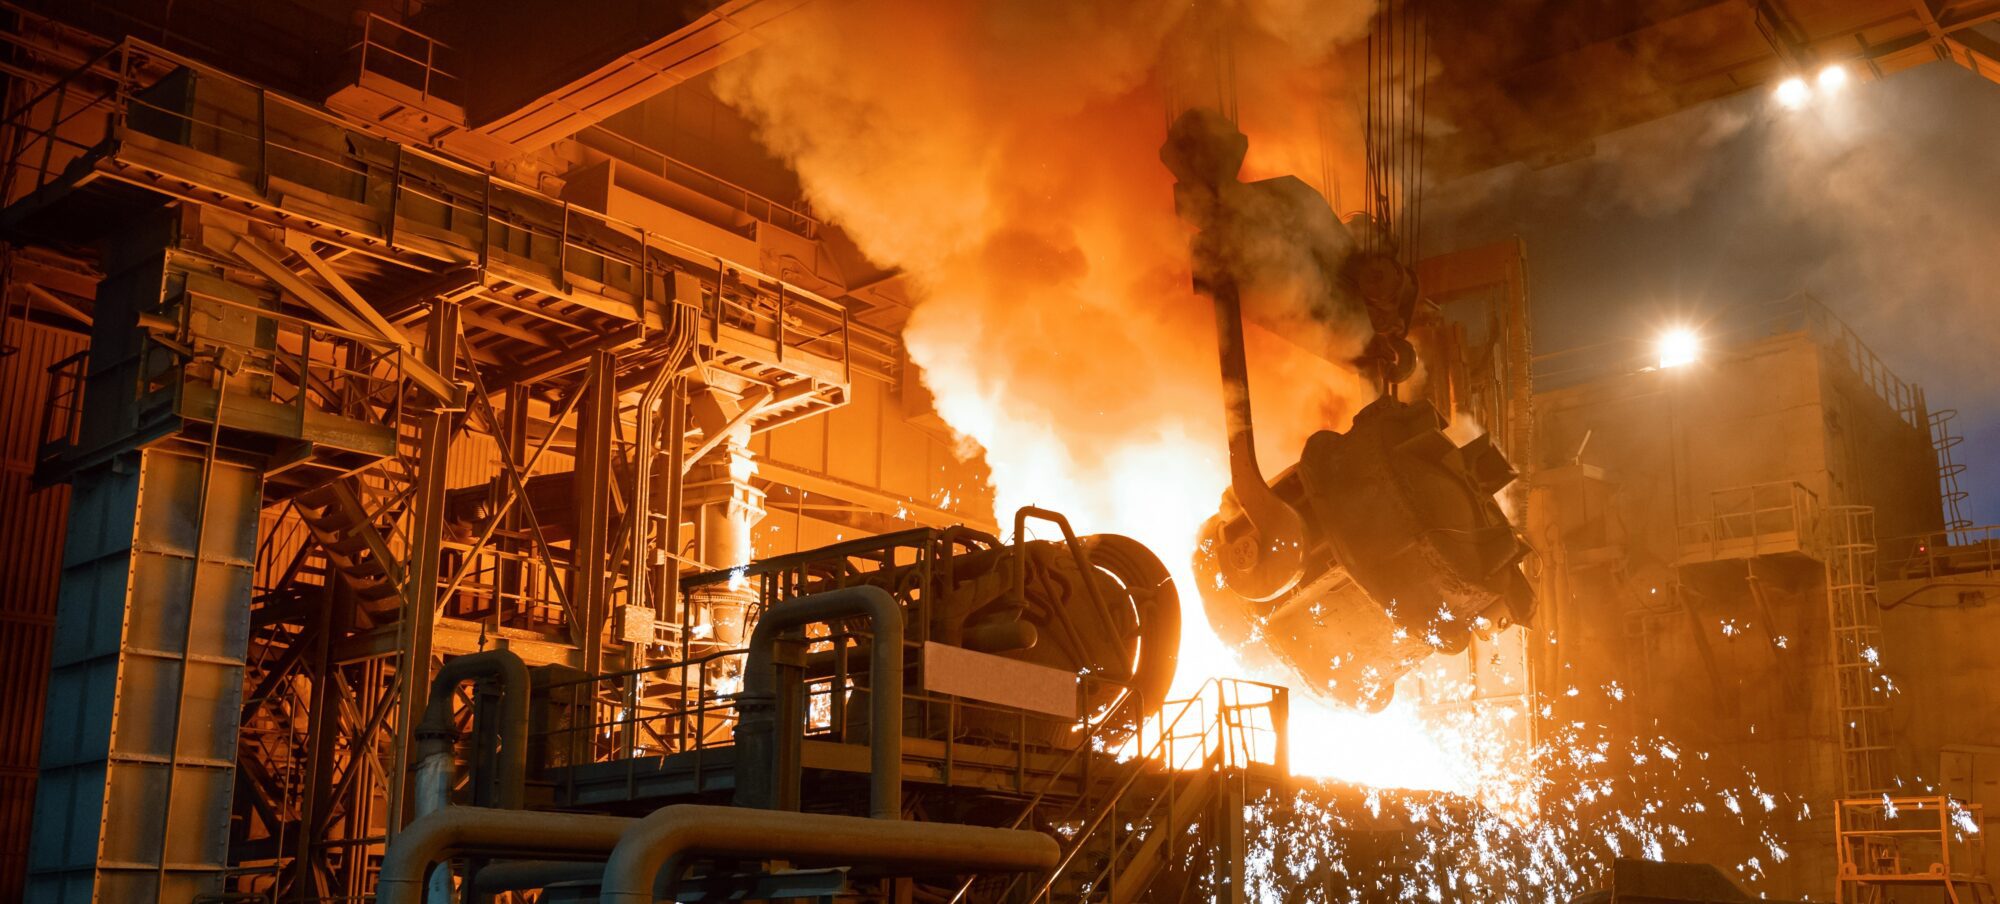
Steel and concrete combine for around 14% of total global carbon emissions and are used primarily in the built environment. Their emissions, along with emissions from other construction products, are referred to as embodied carbon. Photo credit: Nordroden
Understanding Embodied Carbon
Embodied carbon describes the greenhouse gas emissions that occur during the life span of a product, from the initial material procurement through end-of-life. The embodied carbon of a steel wide flange beam, for instance, includes emissions from the mining and transportation of raw and recycled materials, manufacturing into the required shape, transportation and installation into the building, and the eventual demolition and transportation to a landfill or recycling plant. The embodied carbon of a building usually describes the sum of all embodied carbon impacts of all the building materials during the project lifespan, including estimated future emissions from material upkeep and replacement.
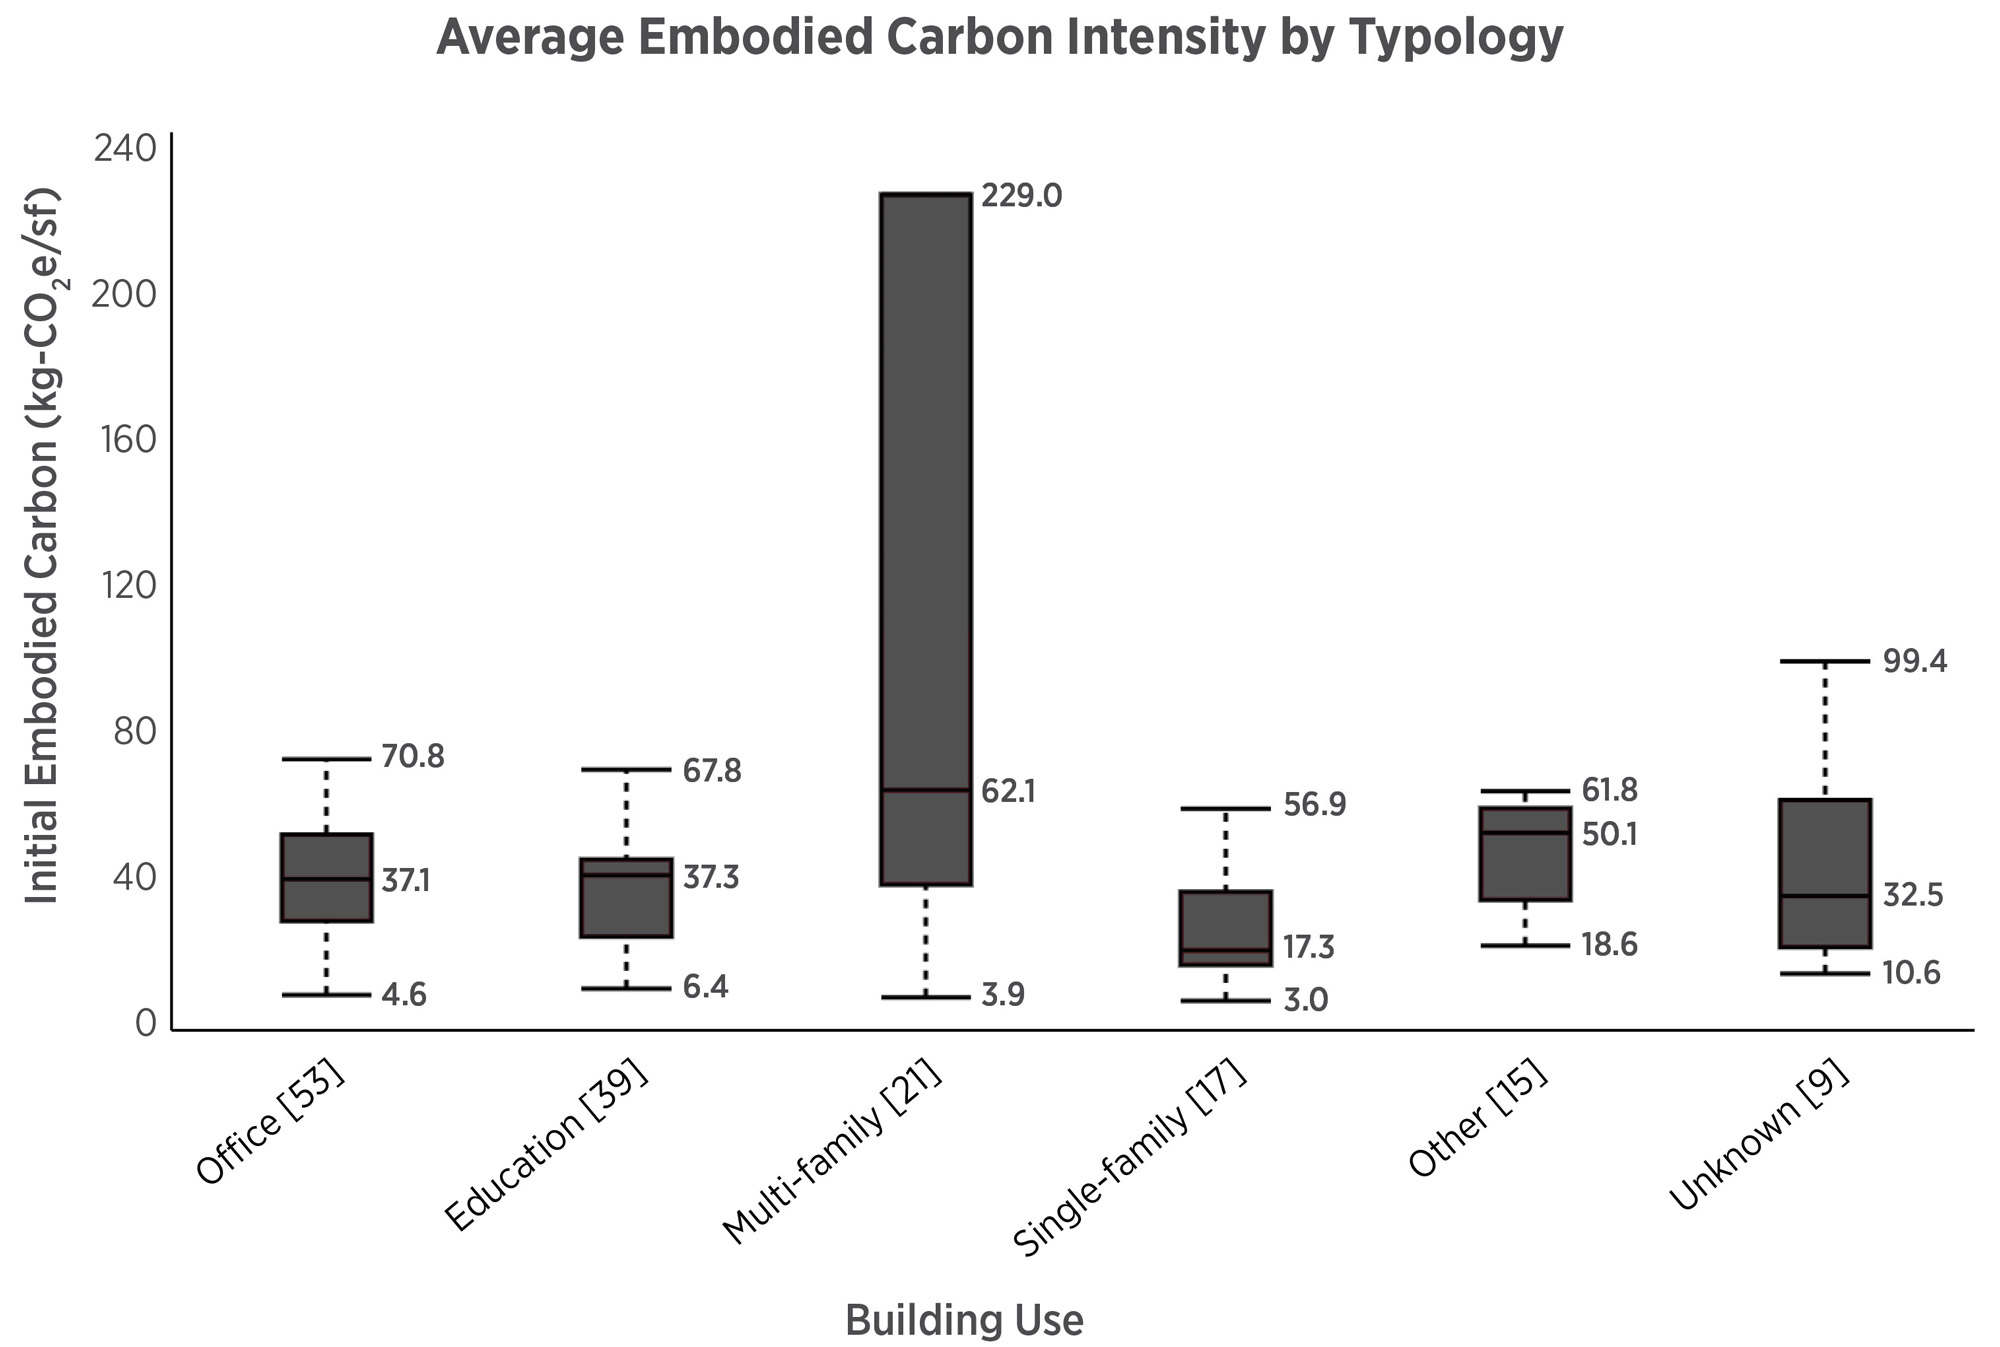
Initial Embodied Carbon can vary between project types but remains a substantial source of carbon emissions across all buildings. Source CLF 2017 benchmarking study. A much more detailed and broad study is currently underway.
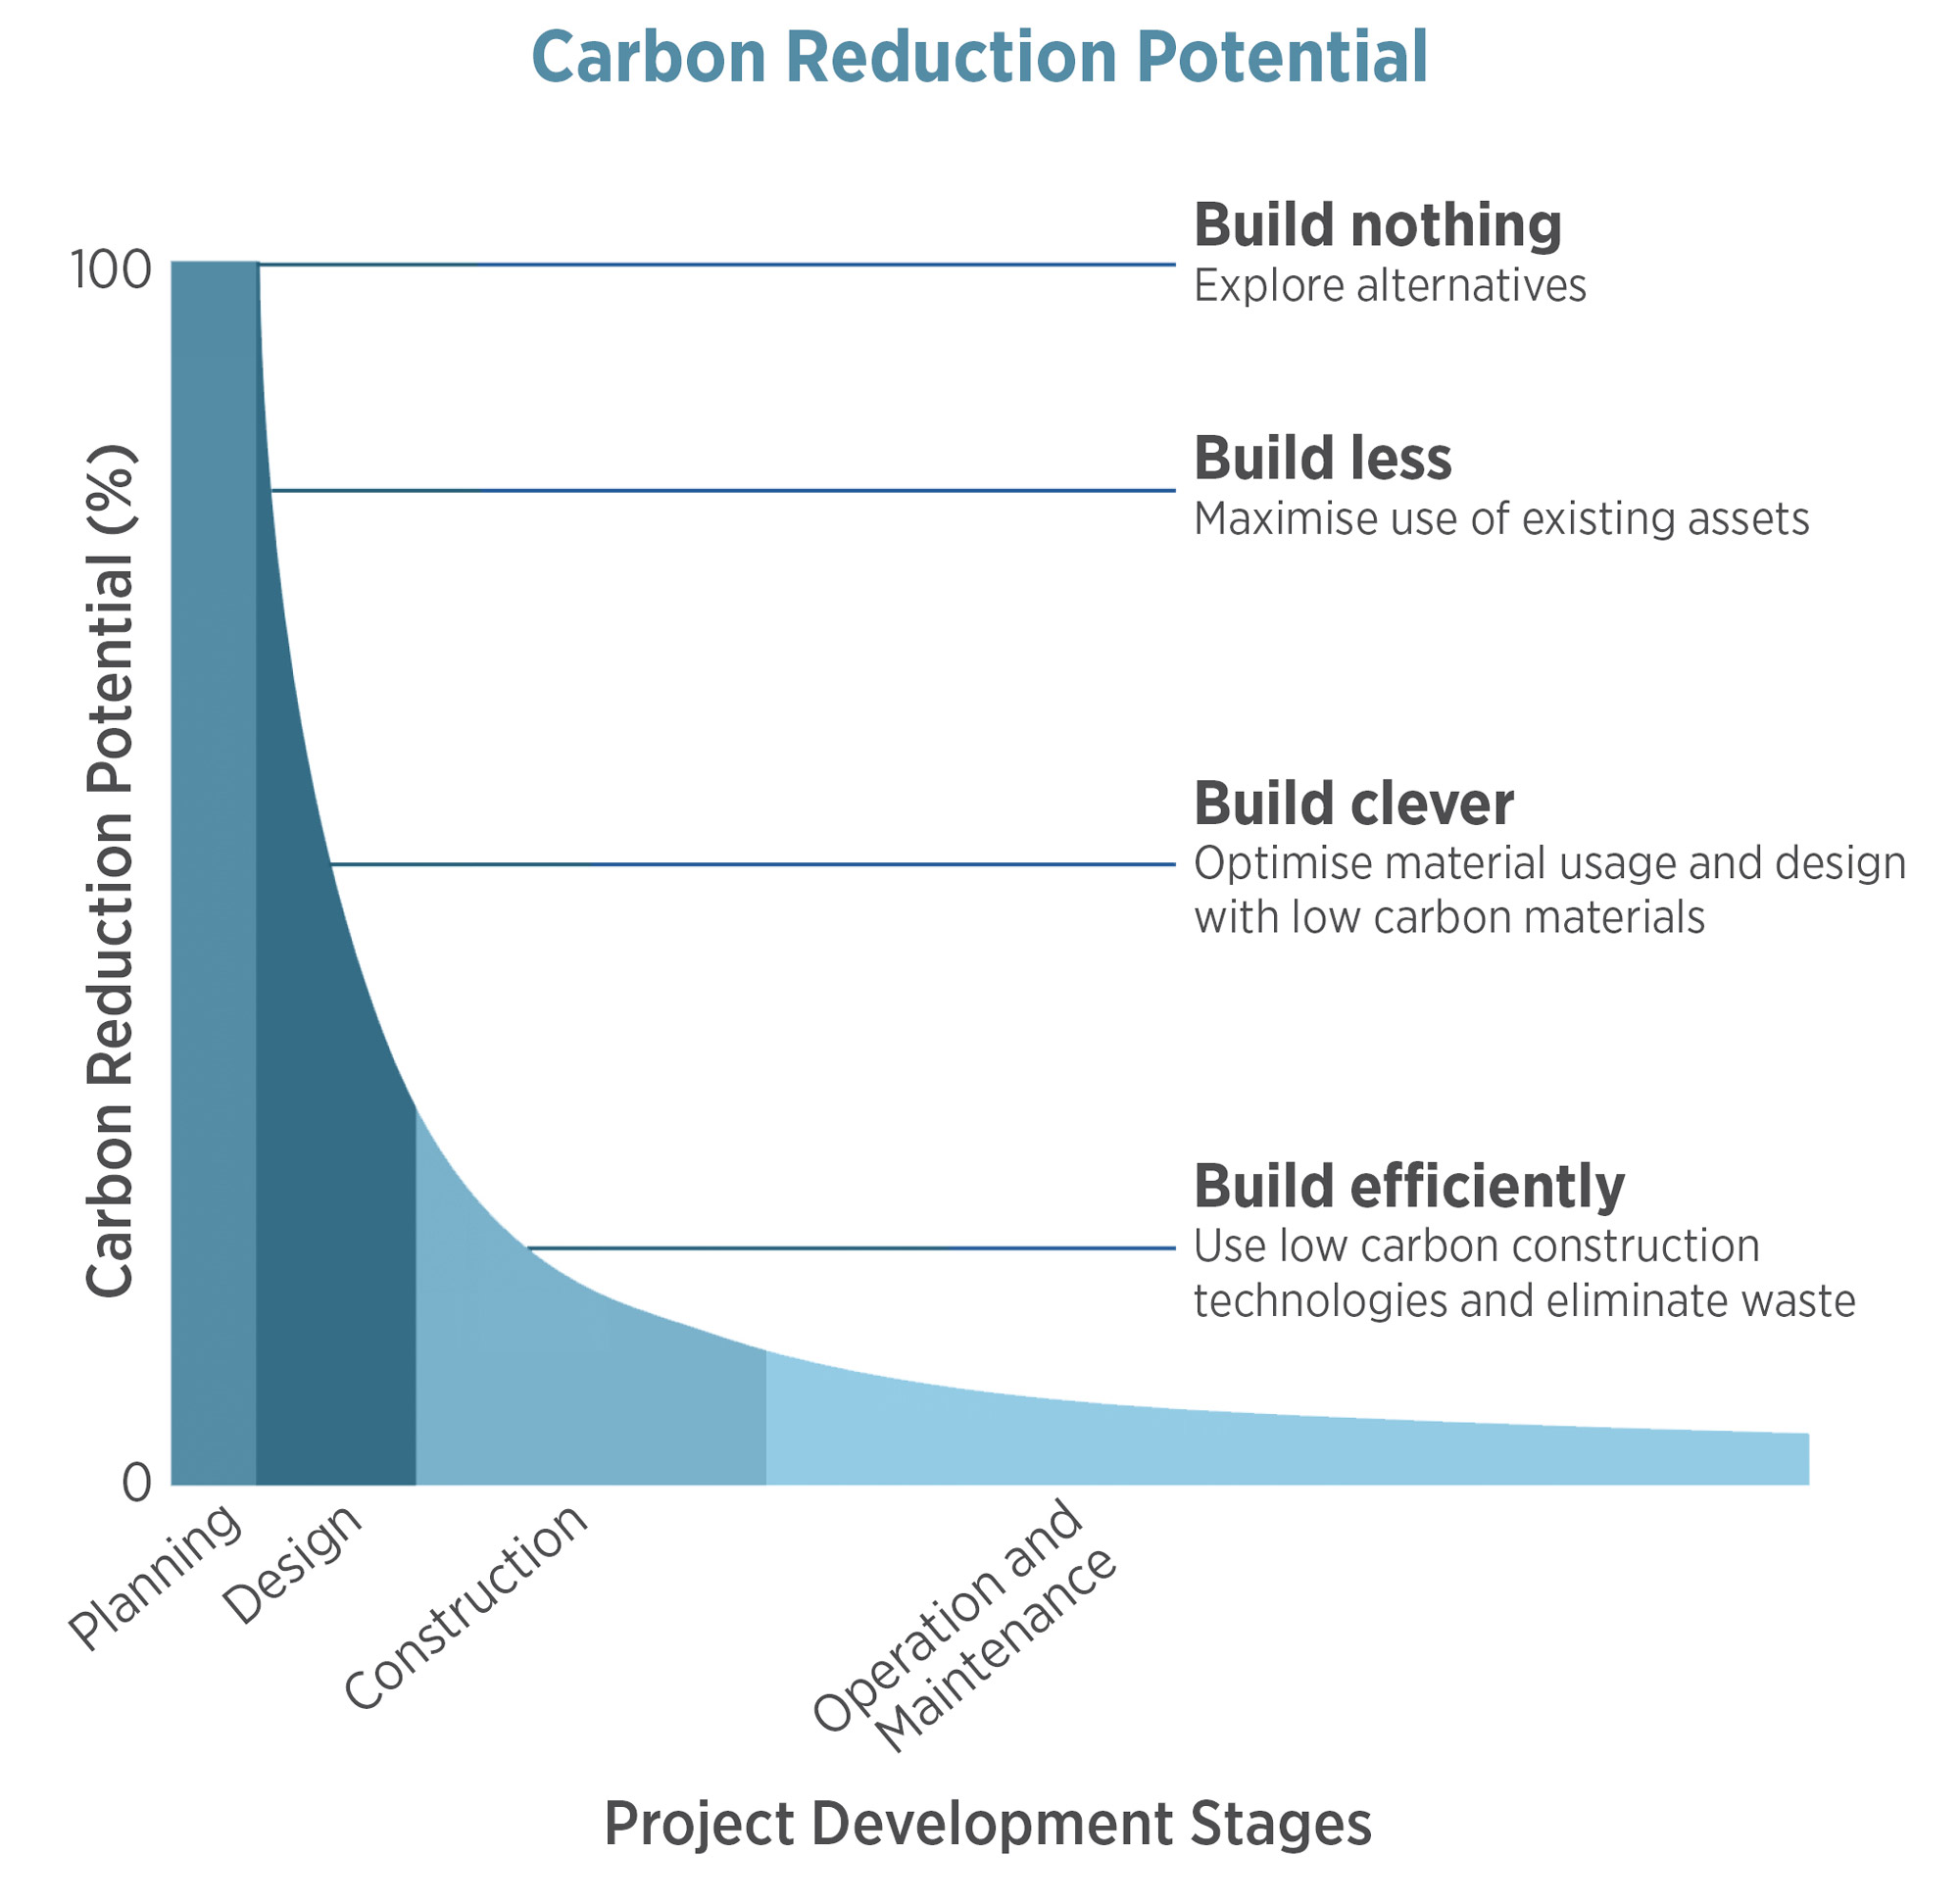
The biggest opportunities for embodied carbon reduction happen during the planning and design phases, where project teams can greatly reduce their emissions for little cost and impact. Source World GBC
The embodied carbon of a building is substantial. A 2017 study by the Carbon Leadership Forum shows that the embodied emissions of structural and envelope materials typically range from 20 kg CO2e/sf to 100 kgCO2e/sf, depending on building size, typology, and other factors. In areas with a cleaner electrical grid, this is often equal to 20-50 years of energy use carbon emissions. As most North American embodied carbon studies also exclude interiors, furniture, MEP systems, the temporary works consumed in a project’s construction, and other systems, the impact of embodied carbon is almost always underreported. With the carbon emissions from energy use dropping dramatically (Post 06), building materials are likely to be the primary source of emissions for many buildings we are designing today over their lifetimes.
Total embodied carbon emissions make up around 10%–23% of annual global carbon emissions; it also represents a substantial opportunity to reduce climate impacts right now. Unlike operational carbon emissions that will take decades to reduce through renovations and greening the energy grid, embodied carbon is spent each year as the direct result of design and construction decisions. Major embodied carbon reductions can be locked in early in the design process, where there are fewer stakeholders to navigate and where changes require little to no additional cost.
The Carbon Leadership Forum (CLF) and Resources
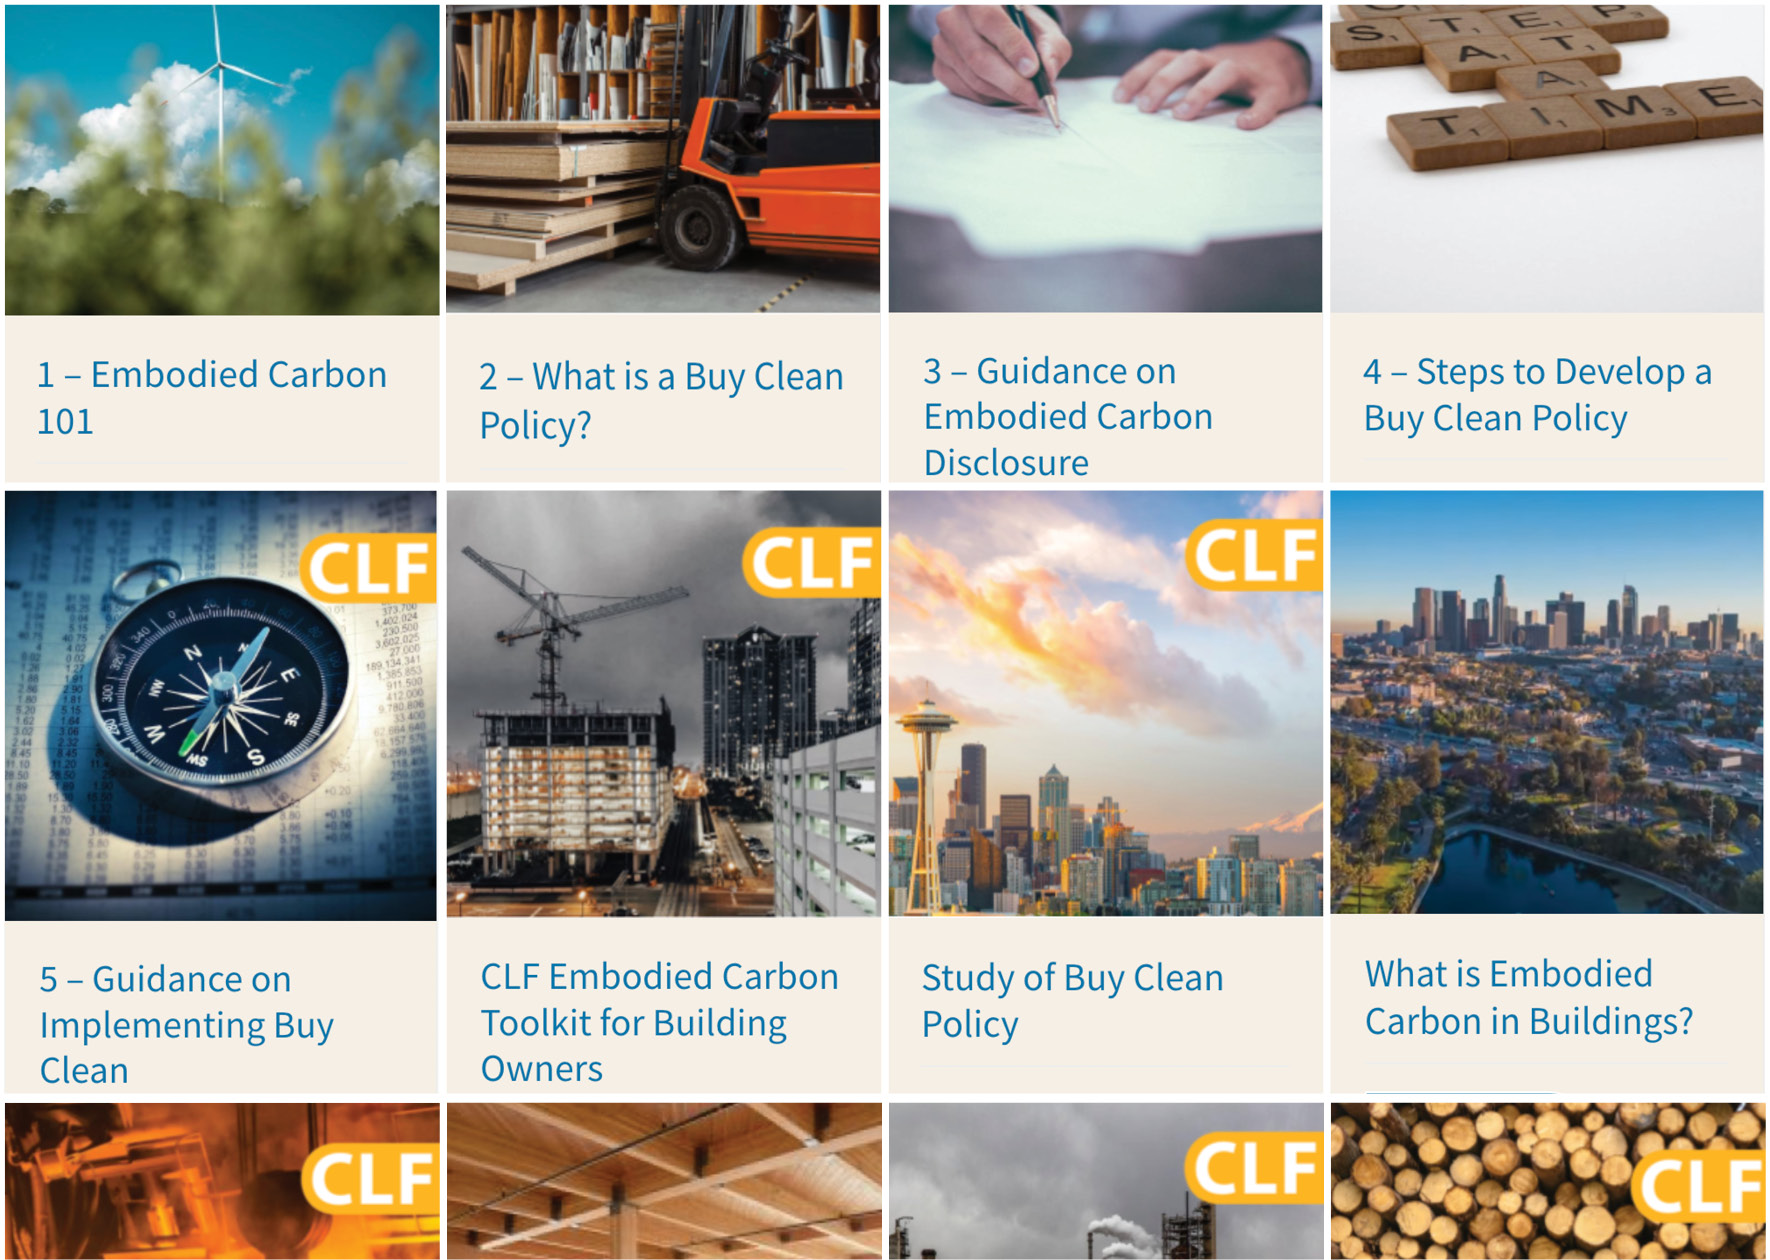
The Carbon Leadership Forum library is the aptly named leader in built environment carbon reduction. The image above is a section of their vast library of guidance. Beyond their educational work, they foster discussion hubs, support carbon reduction legislation, and provide tools to quantify and optimize carbon use.
The Carbon Leadership Forum (CLF) is a great starting point for nearly any topic around embodied carbon. A non-profit at the University of Washington, their work includes creating the Embodied Carbon in Construction Calculator (EC3) with Building Transparency to track and reduce emissions during design and material procurement, providing policy toolkits to reduce embodied carbon. They have also organized industry groups to facilitate research and collective action towards rapid emission reductions, including the SE 2050 working group for Structural Engineers, the MEP 2040 working group for MEP engineers, the OwnersCAN group that convenes building owners to reduce embodied carbon, and the NGO/Government Roundtable.
The CLF extends their educational reach through a very popular mailing list where thousands of practitioners connect daily, CLF regional hubs (join one!) that connect people more locally with great presentations and discussions, youtube channels (and regional hub youtube channels) with great videos on all topics embodied carbon, some of the best research, and even a great TED talk by Andrew Himes.
The CLF and the American Institute of Architects (AIA) collaborated on a Toolkit series of pdfs that dive into deeper detail on how project teams can reduce embodied carbon in their designs. The AIA also hosts an article on the top ten ways to reduce embodied carbon and has an online series of courses on embodied carbon. CLF is also compiling a new database of buildings to create baselines to aid architects, engineers, and policy makers in setting embodied carbon targets.
Many other organizations are also producing useful tools and guides, too numerous to list. These include Architecture 2030’s Carbon Smart Materials Palette developer Hines’ Embodied Carbon Reduction Guide.
Where Does Embodied Carbon Data Come From?
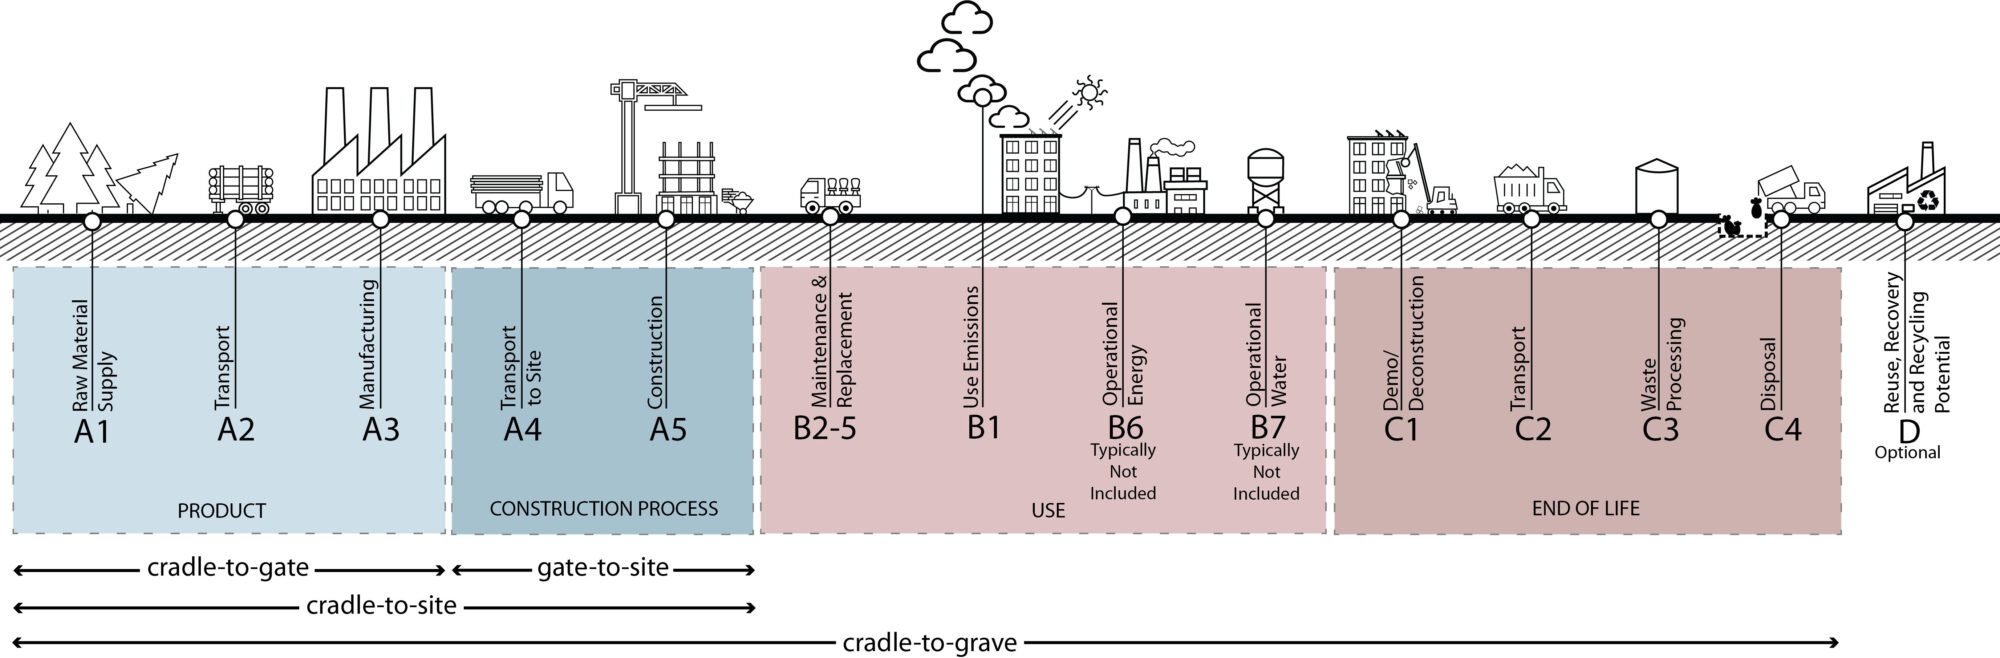
Standard EN 15978 describes the components of Life Cycle Analysis for construction products. Modules A through D include a nearly comprehensive look at emissions and major ecological impacts. For most products, A1-A3 contains the overwhelming majority of carbon impacts.
To understand a building’s embodied carbon, we need to understand the impacts of each product that makes up their buildings: our understanding of embodied carbon data needs to begin at the product level.
In Post 03 we touched on EN15978 which provides the framework for an LCA. Common scopes within EN15978 include “Cradle to Gate” (referring to the gate of the factory that produces the product, modules A1-A3 only) and “Cradle to Grave” which is more comprehensive (often modules A, B, C, and the optional D module). A cradle-to-gate scope contains a vast majority of total emissions for nearly all products, so it makes a good proxy.
Once the scope is determined, data is collected on all inputs and outputs (materials, energy, emissions) to each module and compiled into a Life Cycle Inventory (LCI), which is the list of all inputs and outputs. LCIs typically contain generalized information as product manufacturers attempt to determine the average impacts across their production chain.
LCI data is then collected and converted into a summary format meant for more easy consumption – an Environmental Product Declaration (EPD). An EPD functions as a quick reference guide to the LCI data including full life and stage-related impact totals. While EPDs are typically prepared in accordance with international standards ISO 14025 and EN 15804, not all EPDs are created equally. Data included in them can range from industry-wide averages to product specific, and EPD data can be self-reported, without being verified by an independent third-party. The difference in data quality has led several certification systems to set standards for EPD data, including third party verification. For example, LEED has minimums here.
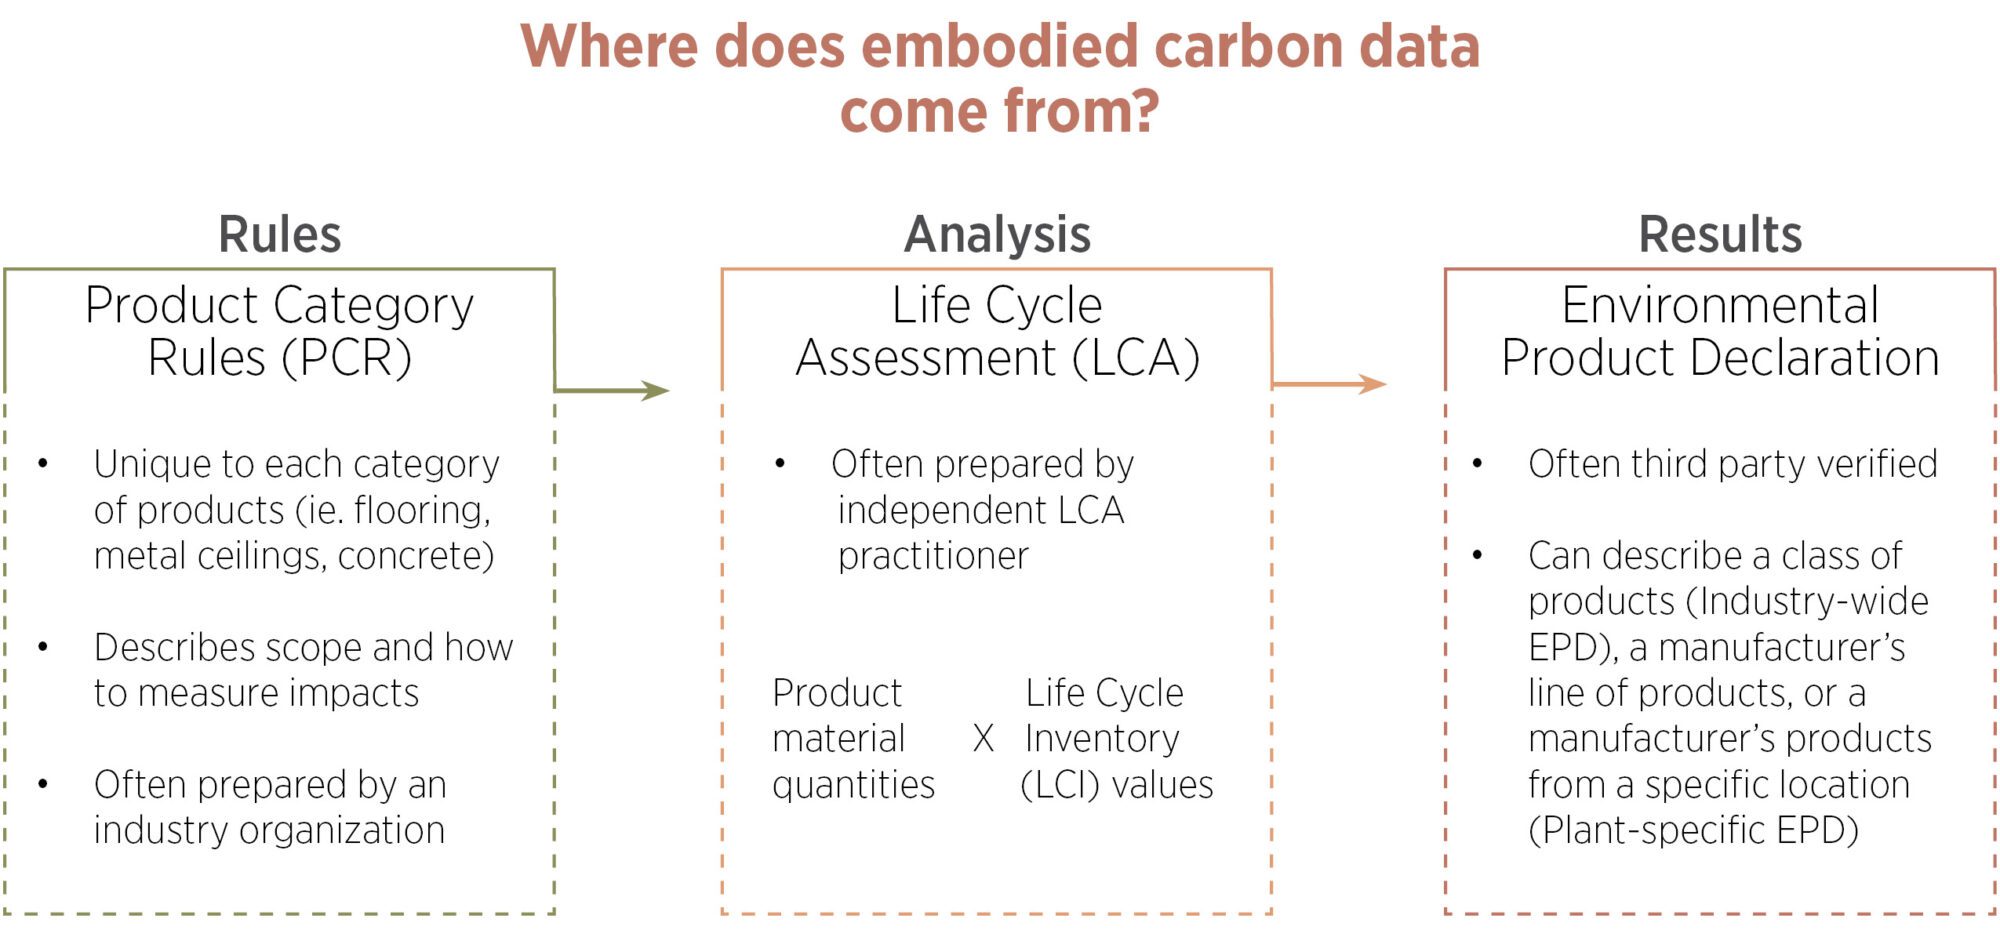
Practitioners generally read embodied carbon data from Environmental Product Declarations (EPDs). When EPDs follow the Product Category Rules, are plant-specific and third party verified, they are useful to understand product impacts.
To ensure that EPDs contain useful information, they include set rules for data inclusion and units. Valid EPDs for products of materials of a similar type should follow Product Category Rules (PCRs) that govern what the system boundaries are for that product or material’s data, how to quantify a unit of the product, how different stages are defined, and what impact data should be reported. Different PCRs can have significant variations in the LCA results, so comparing products with differing PCRs requires extra effort. Many PCRs can be found here and here.
Project teams that aim to create a whole building LCA need to gather EPDs for various parts of their project. Typical whole building LCA scopes will include structural, core, and envelope; however, it is increasingly common to find results that take on larger scopes, such as interior elements and MEP equipment. Material take-offs from the design are multiplied by the impacts of the declared unit and the sum totals for all of these calculations are gathered into the Whole Building LCA.
Comparing the Embodied Carbon of Products
With EPDs becoming more common, designers can now identify lower-carbon materials by comparing EPDs, with several caveats:
- Compared products need to use the same PCR. For example, trying to directly compare a brick façade to a composite metal panel façade may not be possible, however, rough estimates may still prove useful for directionally accurate decision making. Special consideration of the “range of possible outcomes” in the C module is important.
- Check to see alignment of expected lifespan, the scopes (A, B, C modules) covered in their EPDs and end-of-life scenarios. For most products, a vast majority of carbon emissions occur in stages A1-A3. An EPD’s transportation emissions, A4, are obviously not specific to your project and can be updated if you know the distance and transportation methods.
- Compare the end-of-life scenarios. The C module may contain multiple end-of-life options, with an estimated fraction of each. You may know more about the end-of-life options in your region.
- Biogenic carbon – carbon that was pulled out of the atmosphere through a biological process and stored in a product during its useful life – is often not included in EPD data.
- EPDs refer to carbon emissions as ‘Global Warming Potential’ or GWP, which most often refers to estimated carbon emissions over 100 years.
To compare similar materials more easily, the Carbon Leadership Forum created baselines for 13 product types (with updated biannually), so a product’s EPD scopes A1-A3 (cradle to gate) can be compared to ‘typical’ or ‘conservative’ baselines in each category based on this methodology. This baseline system is part of the free, online Embodied Carbon in Construction Calculator (EC3) tool, which allows a more EPD data intensive comparison among products. In addition to showing the category specific CLF baseline, EC3 standardizes EPDs within a category, to show how specific products perform against the baseline, as well as against the other options in their categories. Results are also displayed with a confidence range based on EC3’s assessment of data integrity, which isn’t always immediately apparent to casual users of EPDs.
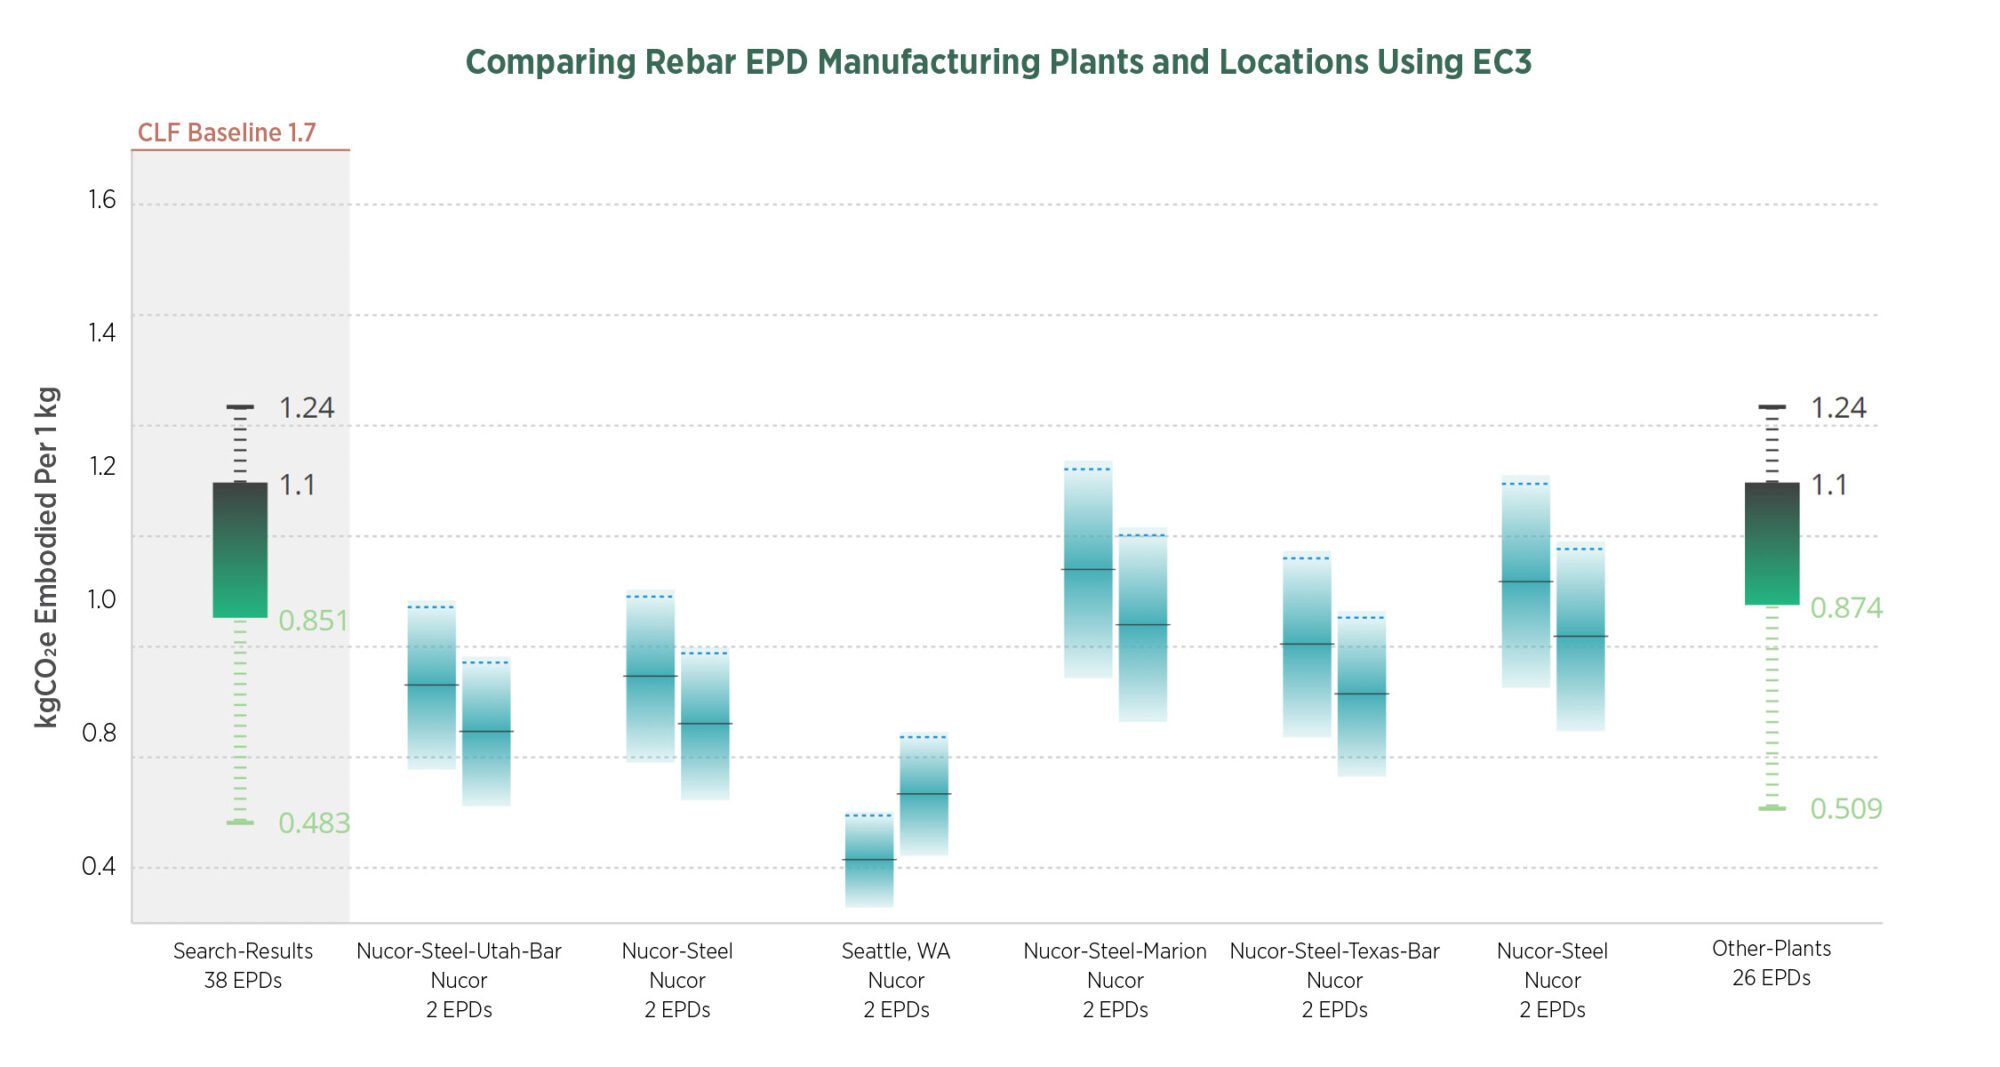
The free online EC3 Tool provides a user-friendly way to more easily compare products’ embodied carbon. A sample screenshot for rebar gives a general comparison of the embodied carbon intensity that can be viewed across plants or suppliers, including a conservative approach to the data ranges.
Beyond Products – Working on a Building Scale
Selecting products is never easy, and embodied carbon adds one more major consideration. When comparing design options, such as different façade designs, LCA practitioners can gain a rough understanding of the impacts by modeling a representative portion of the façade, as well as supporting wall and structure (typically one bay). This kind of study can be extrapolated across larger expanses of identical facade without the need to model each individual element. This type of design study is more useful during the early stages of design development, when WBLCA models would be too slow or contain too many unknown materials to be useful. To this end, Payette created the free online Kaleidoscope Tool to compare the embodied carbon of common building assemblies.
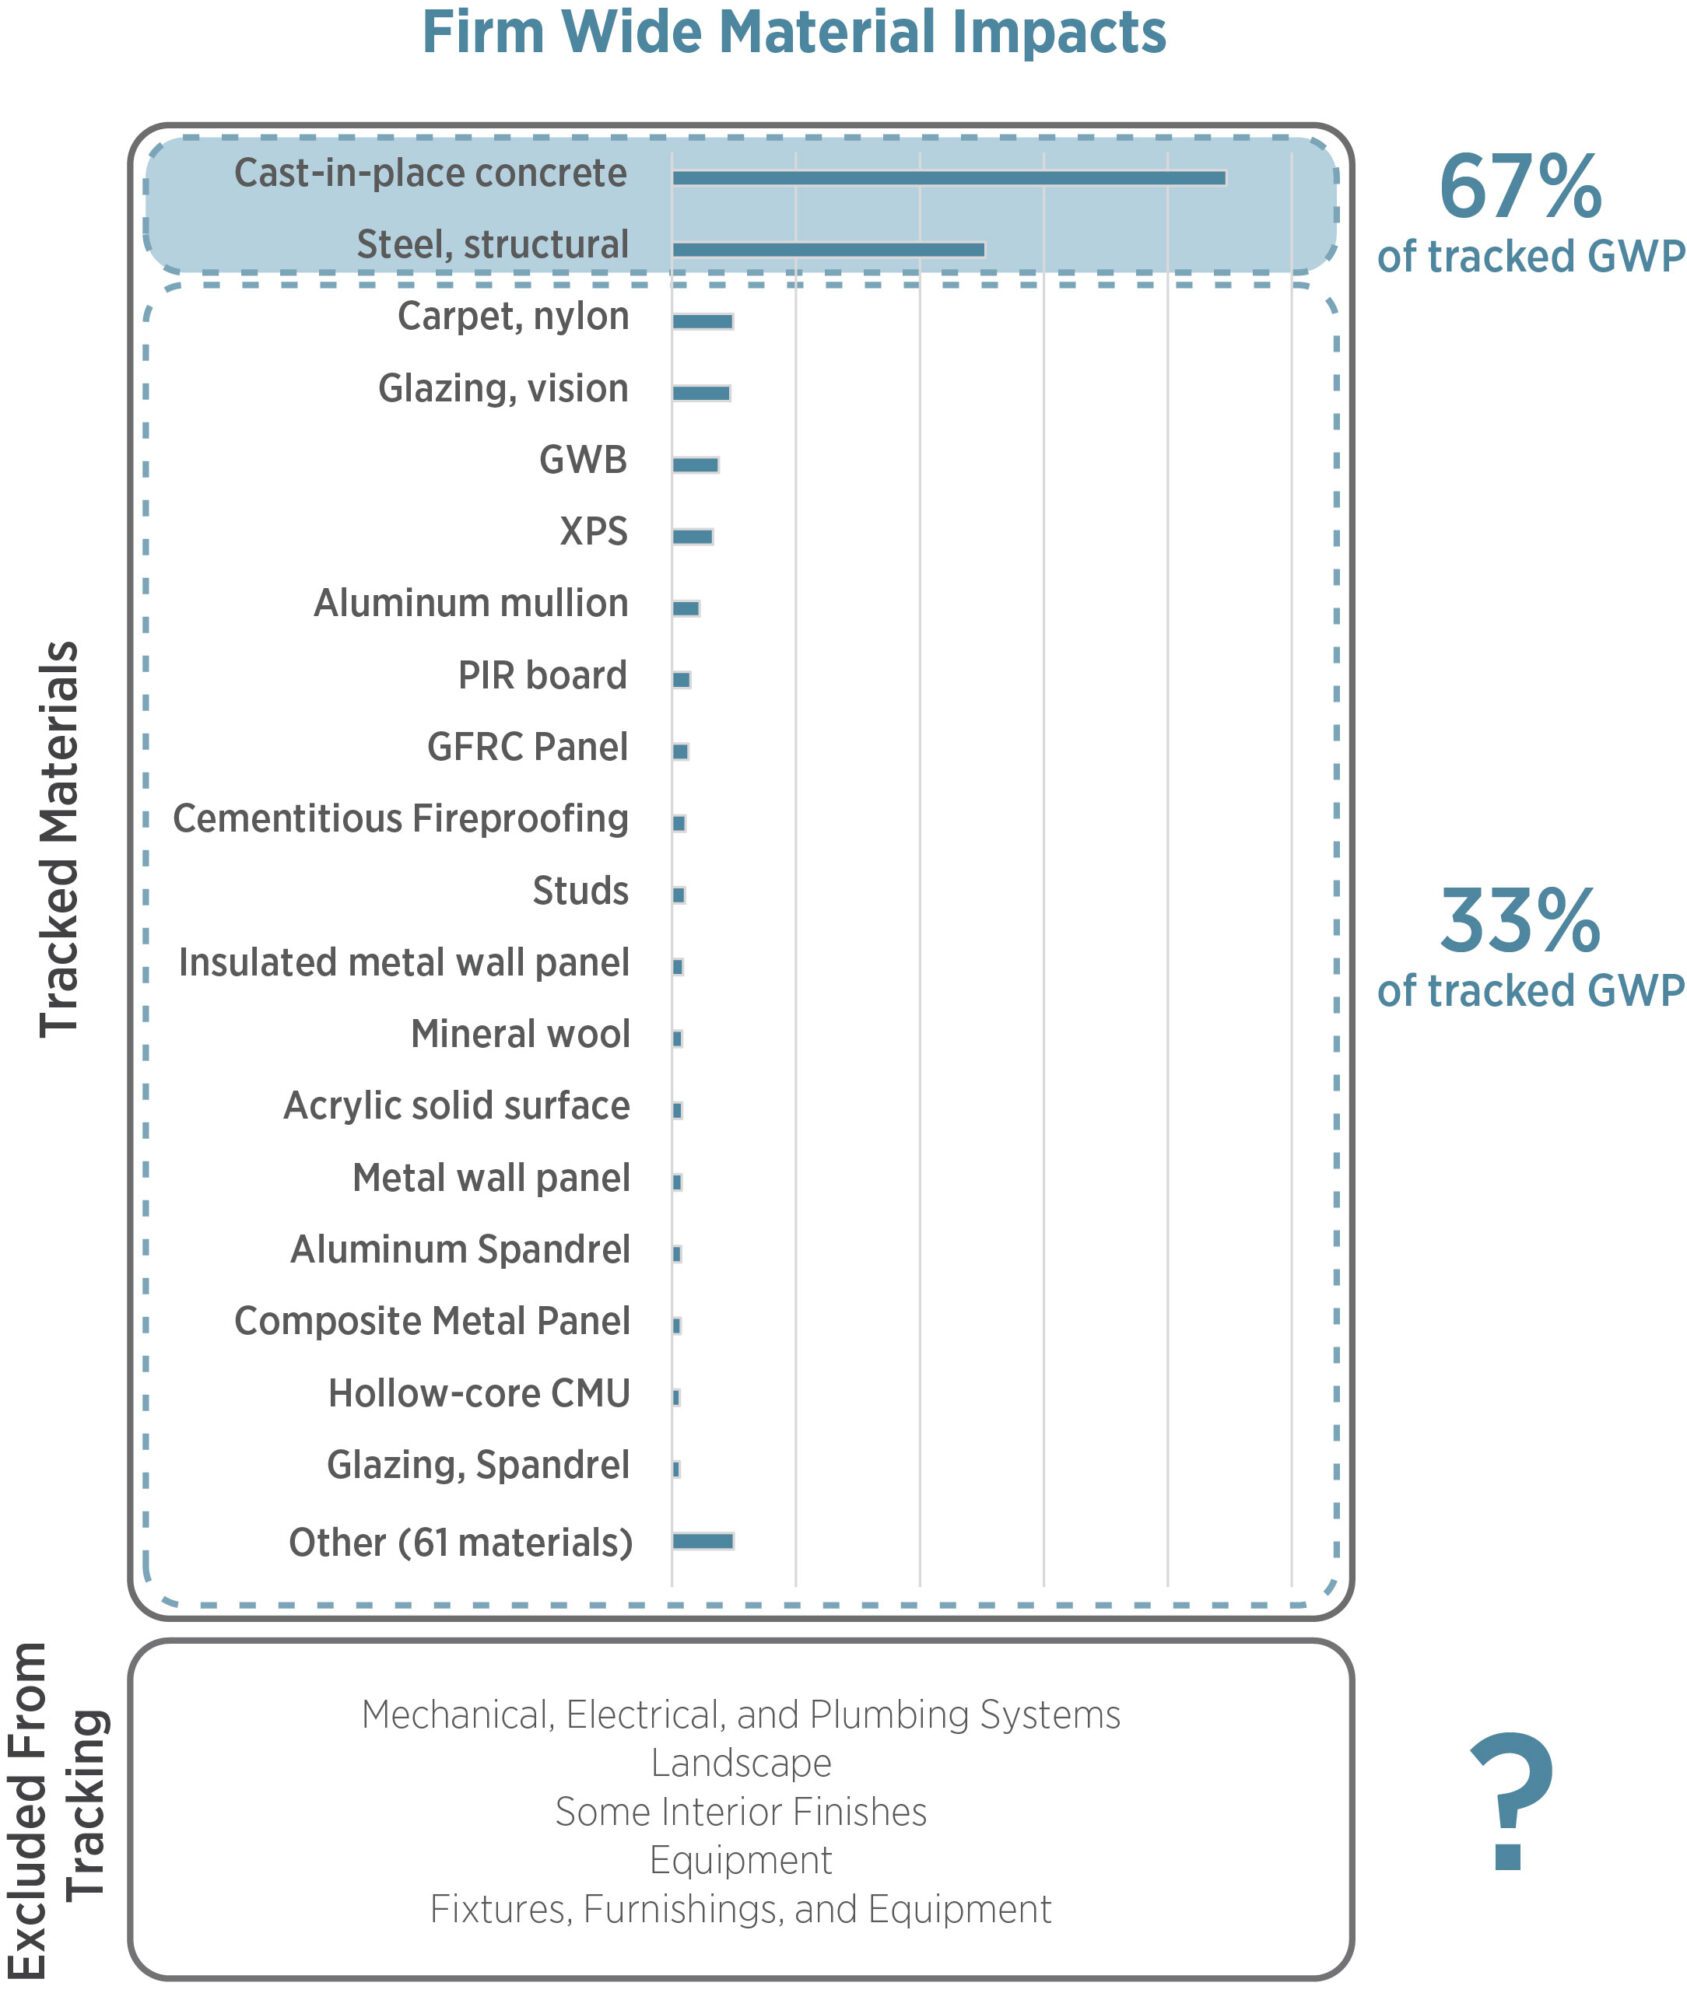
Using the LMN internal embodied carbon database, we found that 67% of carbon emissions across all materials tracked through all LCA studies projects were from two main sources – structural concrete and steel. Since most of our studies include only structure, enclosure, and some interiors, significant sources of embodied carbon are missing.
When looking at the full building LCA results, it quickly becomes clear that certain materials dominate the embodied carbon impacts on most buildings. On many of our projects, when including structure, enclosure, and interiors, over 90% of impacts are accounted for through the top ten carbon intensive materials (Firm Wide Material Impacts diagram). These materials generally share two qualities: they have high embodied carbon emissions per unit; and they are also generally the heaviest materials. Reducing their quantity, weight, or carbon intensity through product selection and procurement has the largest whole building impact. Because mass is often tied to total impact, most LCA studies have a cutoff threshold, where materials consisting of under 1% of total building mass can be ignored, as long as all ignored material does not exceed 5% of total mass. High mass materials should also be considered good targets for material replacement. Replacing large quantities of materials with a carbon-sequestering alternative may have the largest negative emissions impact.
For now, the majority of our impacts tend to remain within a few materials, but industries are moving quickly to lower emissions and this list will change. Performing LCAs that include a broad range of materials will help identify when this shift happens and allow for teams to rapidly respond by adjusting their product choices and carbon reduction strategies.
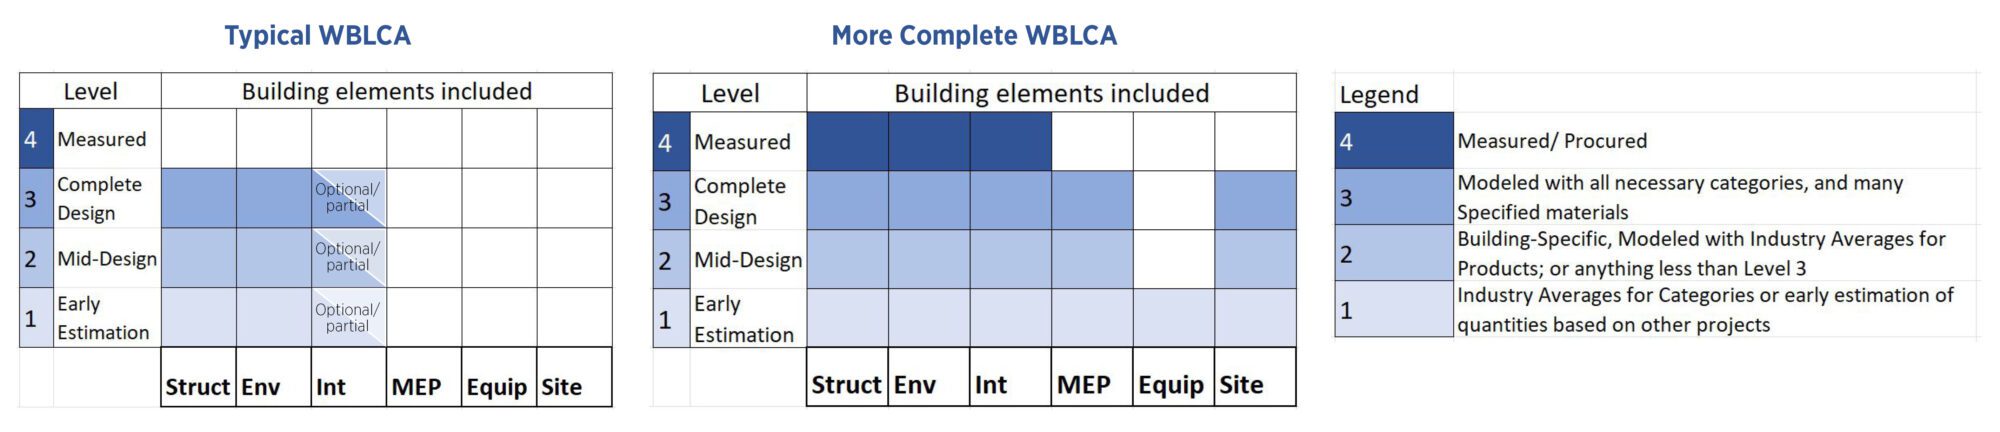
To compare whole building life cycle analyses, our industry needs to develop a way to communicate the scope considered. LMN has developed a system to show 4 levels of completeness. The left chart, for example, shows that Interiors was only partially done and MEP, Site, and Equipment carbon are completely excluded. The middle chart shows that actual EPD data from procurement was used for Structure, Envelope, and Interiors, with detailed estimates for MEP and Site along with a placeholder value for Equipment.
Embodied Carbon 201: Forecasting, Module D and Biogenic Carbon
One of the difficult questions that quickly emerges with LCA data is the importance of B (use) and C (end of life) stage data. Both stages use historical data to anticipate future trends for the sake of a full life analysis. However, the farther we look into the decarbonizing future, the less that historical data is likely to correctly anticipate future conditions.
- In use stages (B), a typical LCA assumes that worn out material will be replaced with an identical copy of the original material, including the same emissions impact. We anticipate decreasing emissions for products farther into the future.
- End-of-life stages (C, and optionally D) include a weighted average of end-of-life scenarios, spreading out impacts between recycling, landfill, and waste-to-energy uses for a single material based off historic waste flow percentages. We anticipate that end-of-life outcomes will trend towards a more circular economy (Post 09)
- For modules B, C, and D, using a discount rate as recommended in Post 05 will lower the relative importance of emissions that are far in the future, acting as a proxy for unknowns.
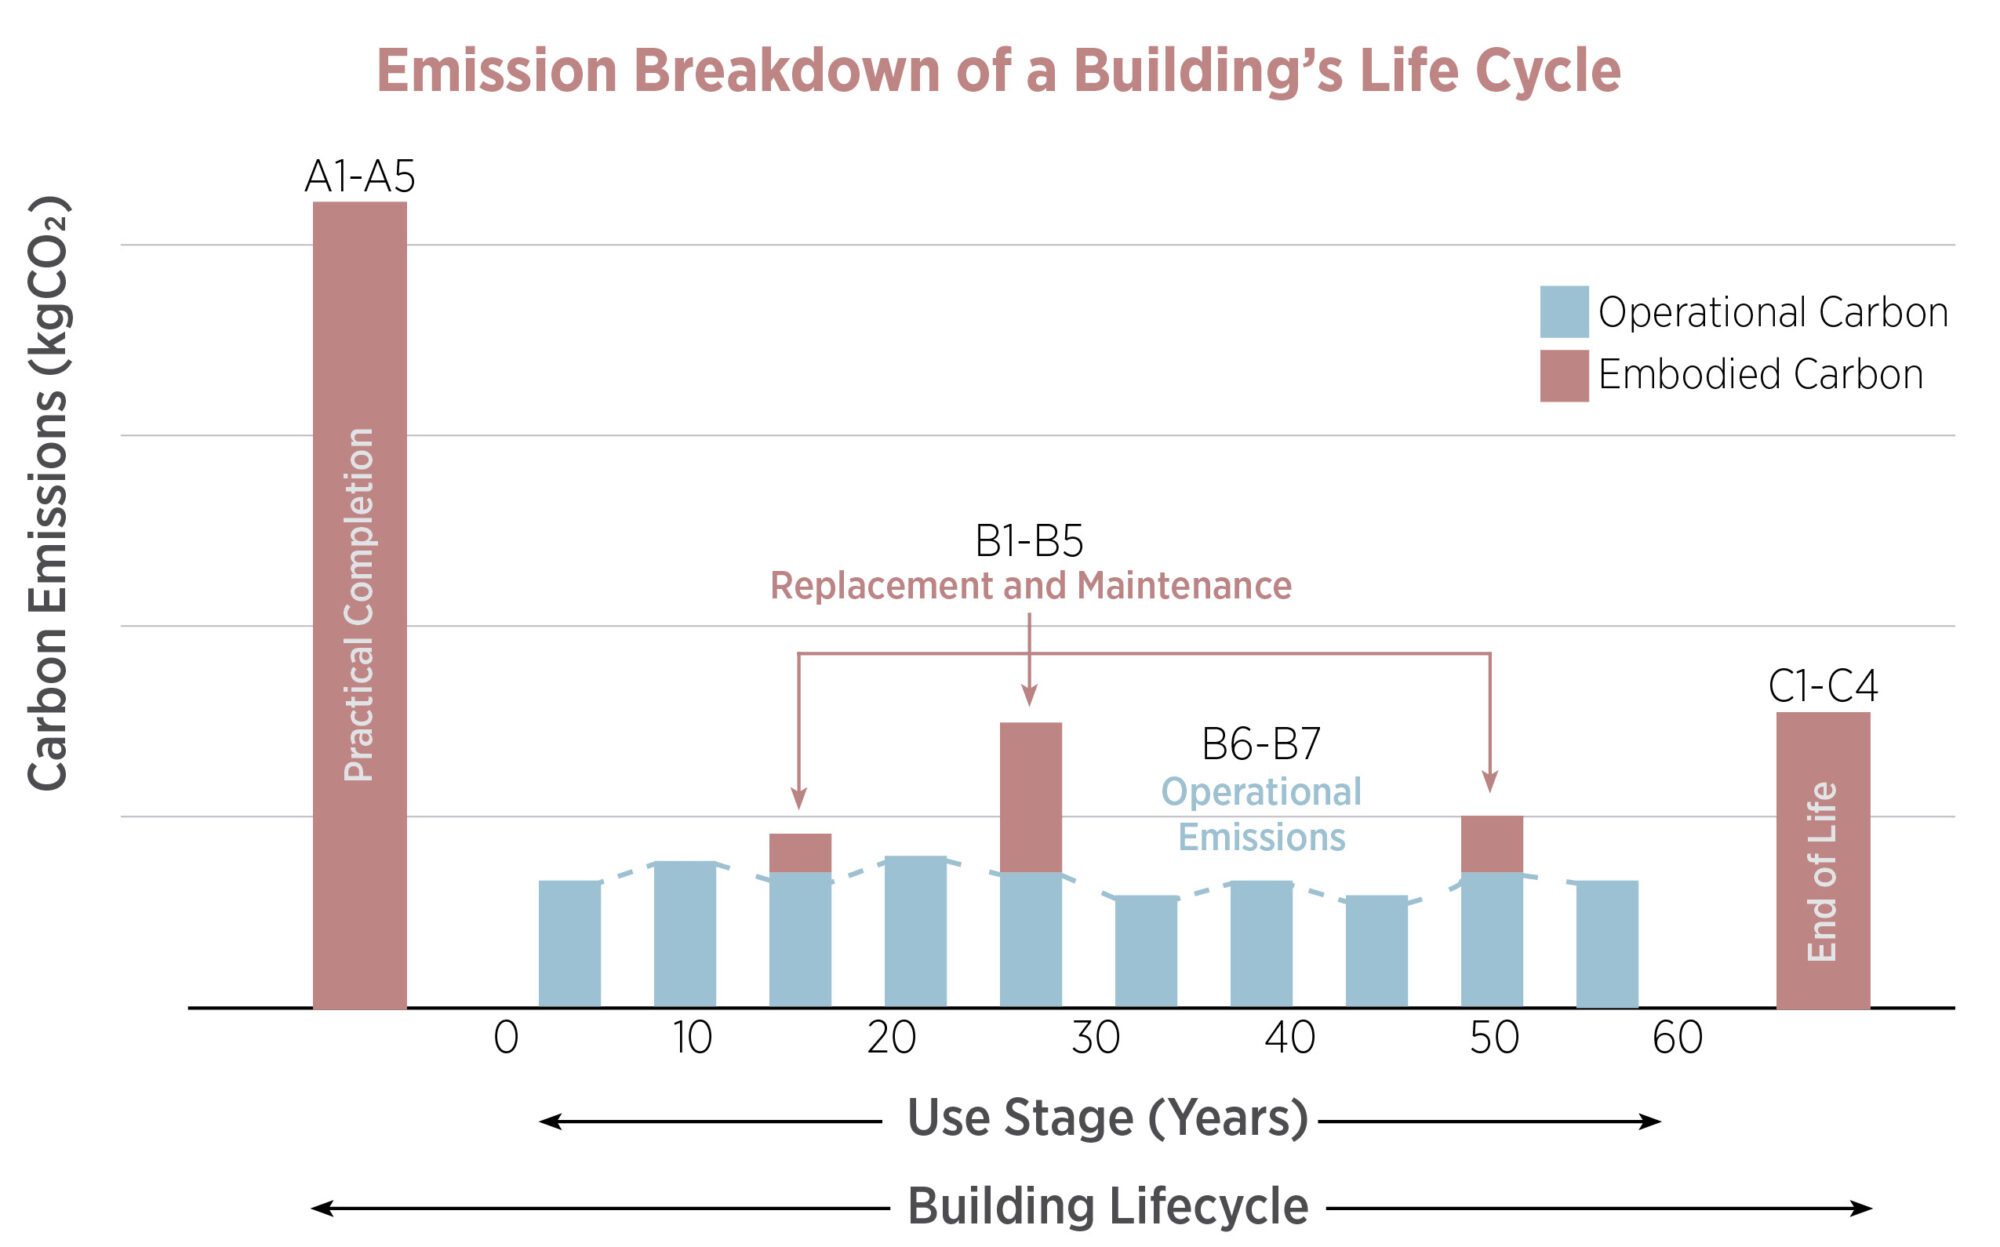
Initial embodied carbon (stages A1-A5) often dwarf years of operational carbon emissions and outweigh use stage (B) and end of life stage (C) emissions. Source London Energy Transformation Initiative Embodied carbon primer
Module D assumptions also need some unpacking. Module D is optional and communicates both additional benefits and harms outside of the product’s lifecycle. This is most commonly used for highly recycled products like steel or in products that are reused in some capacity after removal from their initial life span. Module D allows for the manufacturer to assume this end-of-life scenario, often taking credit for reducing the need for new material in the future. Standards and technical guidance suggest that the impacts related to module D assumptions are to be reported separately. Numerous uncertainties accompany this accounting, and many practitioners ignore module D impacts when determining the whole building LCA, as they can be used to hide high initial embodied carbon costs.
Perhaps the most hotly debated element of LCA data is the inclusion of biogenic carbon. Biogenic carbon is the carbon sequestered into materials through biological processes, such as a tree converting CO2 into plant fibers. Since much of the stored biogenic carbon may be released during the module C ‘end of life’ phase, some practitioners question whether or not designers can take credit for the carbon storage. Others argue that credit should be given since bio-based materials store carbon while new crops continue to draw down carbon from the atmosphere. Beyond carbon storage in the material itself, the debate often involves discussions over soil carbon health, crop rotation periods, and healthy farming practices. Unfortunately, this subject is too nuanced to cover in a single post. For those looking for guidance, we can say that as a firm, we currently believe that biogenic carbon offers a massive potential for carbon storage and drawdown, as long as the material comes from sustainably harvested sources and is not displacing or increasing the cost of food systems. More on this subject in Post 08.
Conclusions and Recommendations
Industry action on embodied carbon is still immature, but quickly spreading. Data quality is improving rapidly, and many of the larger carbon offenders are pushing towards transparency and optimization. Plans to reach zero carbon buildings are being envisioned. The amount of guidance and knowledge surrounding embodied carbon studies is growing daily, lowering the barrier to entry.
Recommendations
- Educate ourselves – the Carbon Leadership Forum has several quick resources to get teams up to speed.
- If you haven’t looked at an EPD, download one and look for the Global Warming Potential by stage. Even better, go to EC3 and compare EPDs within a class of products (perhaps Finishes -> Flooring -> Resilient Flooring)
- Track embodied carbon impacts and reductions on all projects (start with one!). EC3 is free and usable by most firms with little training. A non-exhaustive list of Whole Building Life Cycle Analysis (WBLCA) Tools includes: Tally, EC3, Athena, OneClick LCA, tool, and others. LMN uses Tally and EC3.
- Target the largest emissions sources for product choice, specifications, and procurement decisions – including concrete and steel. Many of these are on the CLF Materials Baseline. Additional guidance on structural materials is available in Post 11 covers structural materials.
- If taking credit for biogenic carbon, read Post 08.
Please email any questions or comments to Kjell Anderson, kanderson@lmnarchitects.com
Thanks to our external collaborators and peer reviewers
Catherine L. Cai, MKA; Donald W. Davies, MKA; Meghan Lewis, Carbon Leadership Forum; Kristian Kicinski, Bassetti Architects; Brad Benke, Carbon Leadership Forum; Kelsey Leigh Wotila, University of Colorado; Michelle Amt, VMDO Architects
LMN Architects Team
Huma Timurbanga, Justin Schwartzhoff, Jenn Chen, Chris Savage, Andrew Gustin, Kjell Anderson
Posted: 10/24/2022
The text, images and graphics published here should be credited to LMN Architects unless stated otherwise. Permission to distribute, remix, adapt, and build upon the material in any medium or format for noncommercial purposes is granted as long as attribution is given to LMN Architects.