#pathtozerocarbon, #sustainability
05 – Carbon, Risk + Time
Why have the years 2030 and 2050 been chosen for many climate-related goals? Why have member of the United Nations agreed to try to limit global warming to 1.5°C (2.7°F), or 2.0°C (3.6°F)? These guideposts help align action on the urgent transformation to a low-carbon economy to avoid the biggest risks of catastrophic climate destabilization.
Why 2030, 2050, 1.5°C, and 2.0°C? Our Carbon Budget.
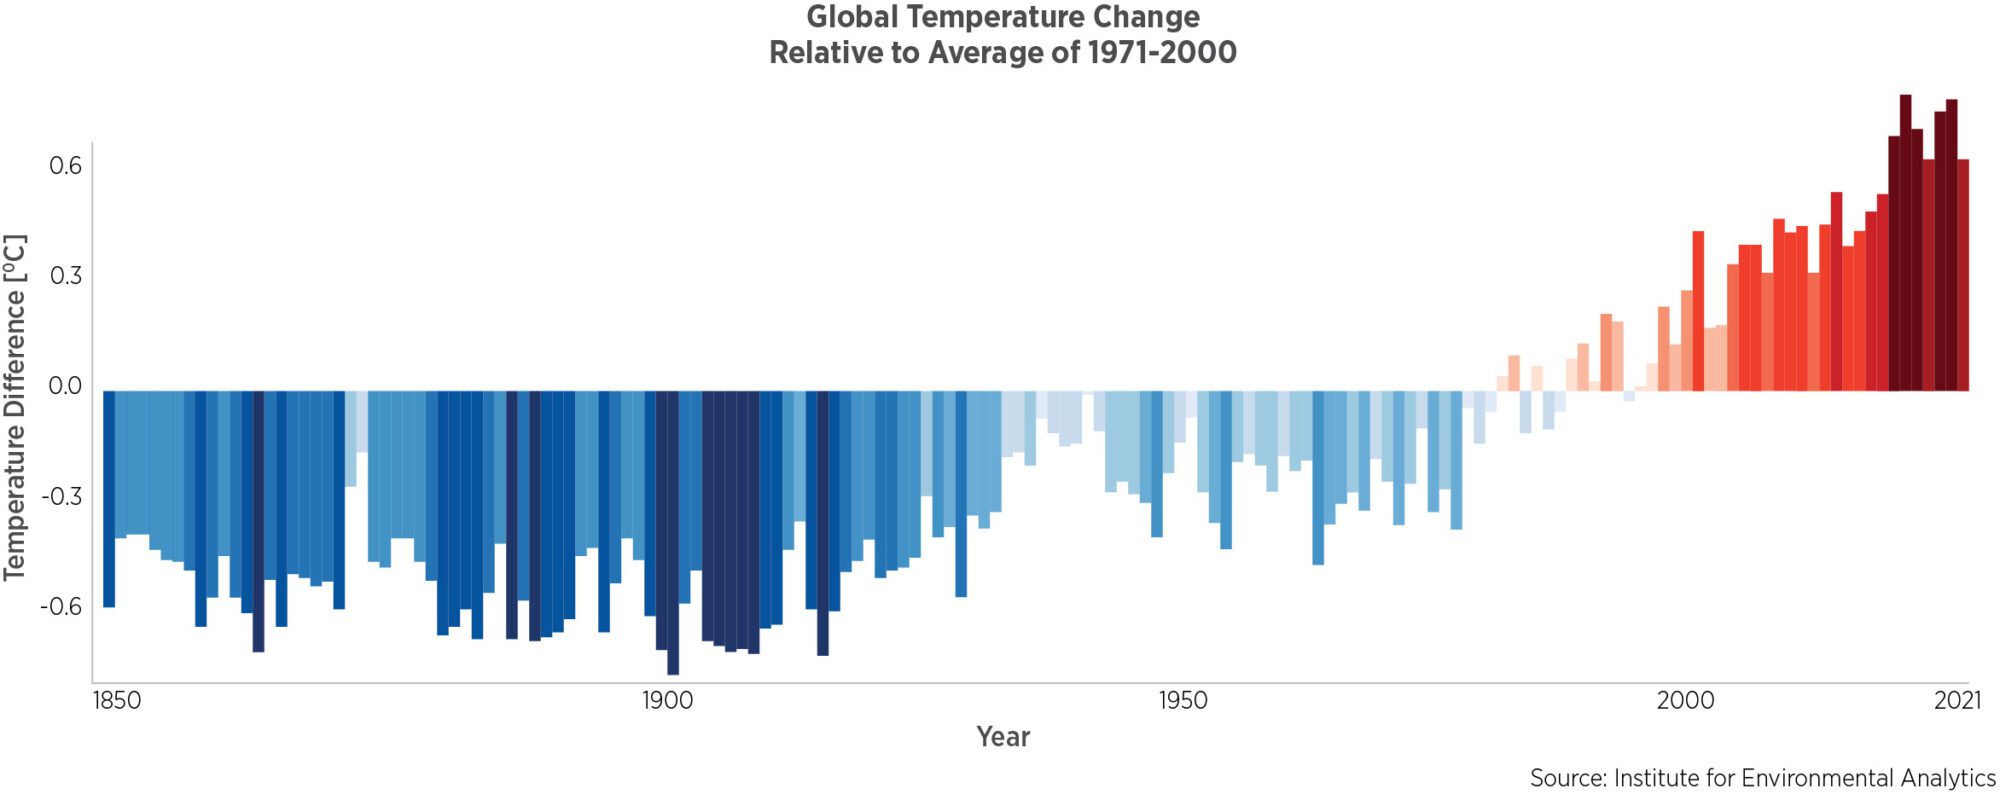
Our earth’s surface had warmed by around 1.1°C (2.0°F) by 2021, with the first full year above 1.5°C reached in early 2024, and continues to warm, aligning within climate scientists’ predictions based on natural and human-caused emissions. The warming trajectory is currently around 0.2°C of warming per decade, although it is accelerating. This is due to both new emissions each year as well as past emissions that will continue to cause warming for decades or longer.
According to the IPCC’s 6th Assessment Report (2022), human actions since the widespread use of fossil fuels began have raising the average carbon dioxide (CO2) in the atmosphere from approximately 285 ppm to 410 ppm since 1850, with most of this increase since 1960 when it was around 315 ppm. Since carbon dioxide is the majority of human-caused emissions and atmospheric carbon dioxide levels track historically with global temperature changes, it is a reasonable proxy for overall greenhouse gas emissions.
To limit warming to around 1.5°C we can only release another 100-400 GigaTons CO2e, a figure often referred to as our carbon budget. With a current human-caused emissions rate of around 50-60 GigaTons of CO2e/year, we have to radically reduce carbon pollution every year. Every path forward requires urgent, near-term carbon reductions: includes important targets around 2030; and results in a nearly carbon-neutral economy around 2050. If we quickly accelerate emissions reductions over the next decade (scaling existing practice and technology), we give ourselves more time to spend this budget. This is important because it gives us more time to decarbonize the areas of the economy that will be more technically challenging and those where decarbonization planning and policy will take decades to be fully realized.
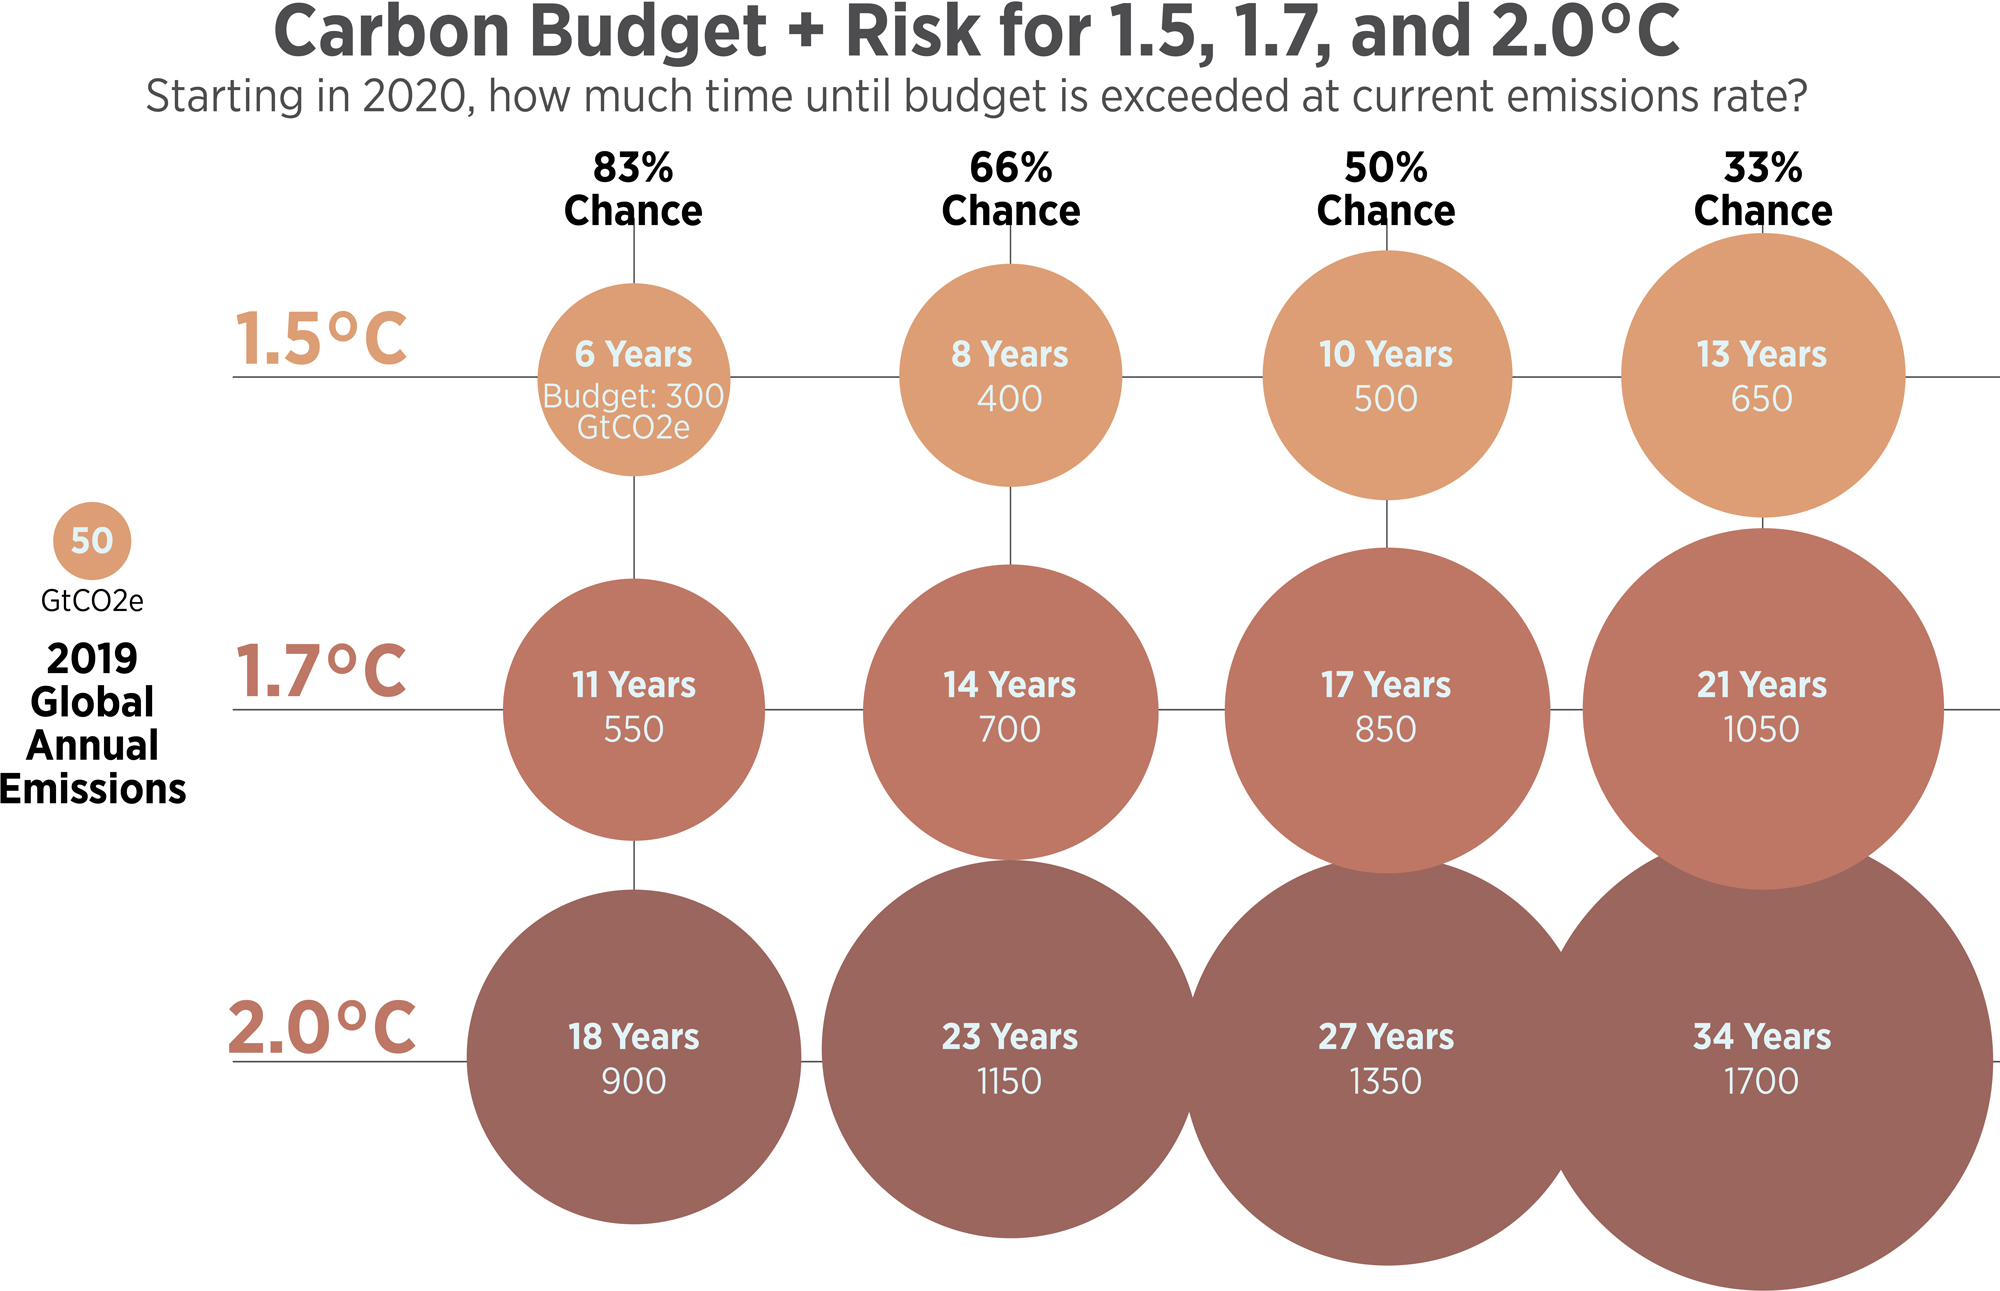
Our remaining carbon budgets and likelihood of staying within temperature thresholds at current global annual emissions rate, IPCC AR6 Table SPM.2 p29
Examples include Princeton’s 5 scenarios to reach our goals and the Science Based Targets Initiative targets based on a 50% chance of staying below 1.5°C. To do this, with 2020 as a baseline, this requires a 42% reduction by 2030 and 90% reduction by 2050, including some carbon removal (Post 08)
The earth has experienced warming and cooling in the past, but not as rapidly as we are warming it now: 2.0°C over thousands of years would allow ecosystems to evolve and humans to adapt. But the speed at which warming is taking place is unprecedented for modern humans and is the main challenge we face. With great effort we are starting to head toward carbon neutrality, but since our current economic and energy systems rely on massive carbon emissions, the speed at which we transform these systems to be carbon neutral will determine the total carbon emissions in the atmosphere. The total emissions determines the risks posed now and in the future by rapid warming.
For the building sector, most pathways for staying within our carbon budget include:
- New buildings avoid burning fossil fuels for heating and hot water very soon, at least by 2030
- Deep energy retrofits of existing buildings occur from now through 2050
- Increase renewable energy production at the building and utility scales toward 100% as soon as possible, and well before 2050
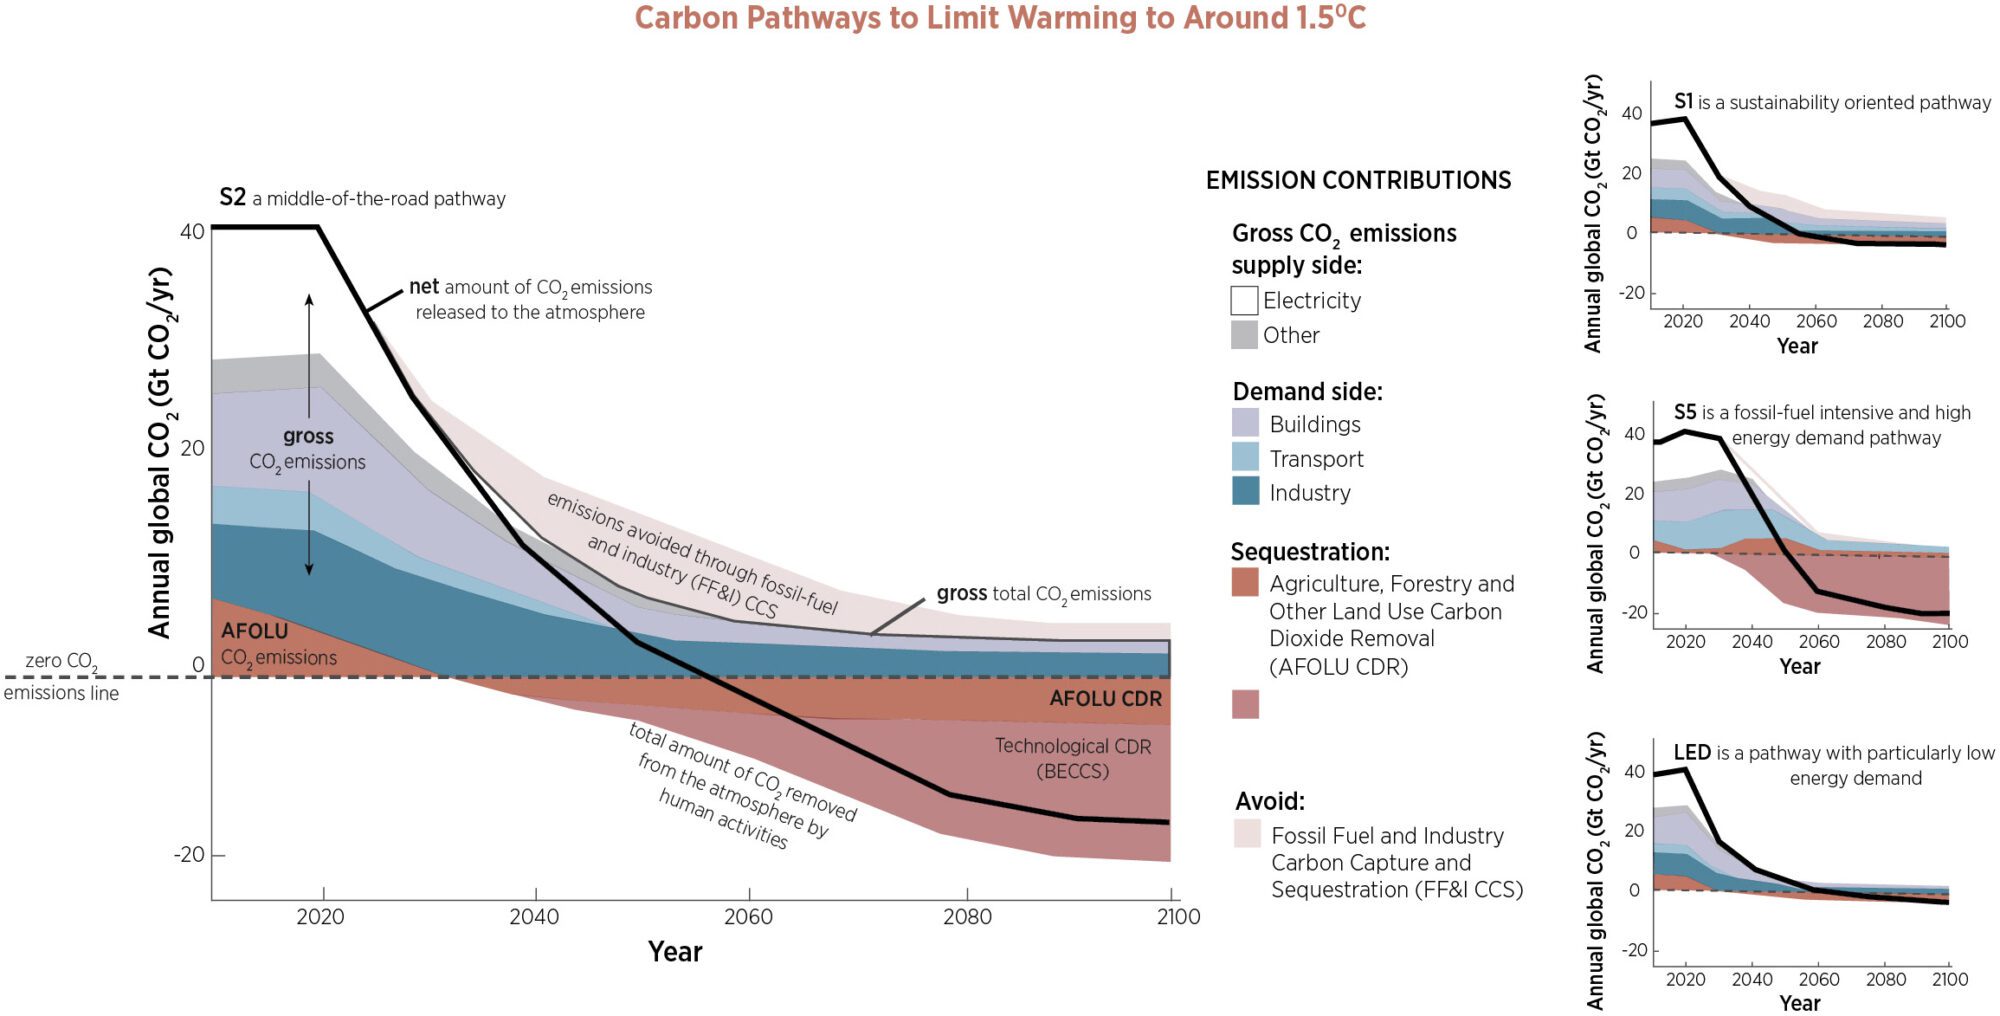
Our Carbon Budget is 340-400 Gigatons CO2e to stay below 1.5°C warming by 2100. These scenarios show just a few pathways to meet that target, but all require significant near-term action that we are beginning to see in leading design teams, governments and corporations. Scenarios S2 and S5 overshoot the budget and then rely on future development and scaling of carbon removal technology, while S1 and LED rely on steeper carbon reductions over the next two decades. Scenarios from IPCC AR6)
Urgency, Risks + Tipping Points
What are the major risk categories of climate change at 1.5°C, 2.0°C, or more? Extensive climate modeling has predicted various outcomes for how the earth, oceans, and atmosphere respond, answering many questions and illustrating impacts and risks graphically.
- Risk of increased ‘natural’ disasters – climate change increases the frequency and intensity of many weather-related natural disasters, adding to human suffering and financial cost from hurricanes, floods, heat waves, wildfire, and droughts. While global warming increases the frequency of extreme weather and disasters, it is difficult to correlate causality with specific events, which is why we talk about increased risk.
- Risks of climate change occurring too quickly for humanity and ecology to adapt. If slow climate changes occurred over centuries, we could more easily migrate and adapt. But changes in agricultural systems, locations and intensity of flooding and water scarcity, sea level rise, and other changes are occurring over as little as a decade, causing significant displacement and destruction. One analysis of large changes is here.
- Risks of tipping points that irreversibly alter climate patterns or ecology as well as feedback loops that increase speed and intensity of warming. For example, permafrost stores about twice the total carbon that is currently in the atmosphere; releasing it through global warming would be catastrophic.
We are already feeling many effects that have been predicted by climate scientists. For example, heat waves are increasing; they are the deadliest weather hazard in the US, responsible for an average of 65,000 hospital visits and 600 deaths annually, primarily children, the elderly, and the poor. Rivers – and drinking water – are often supplied by mountain snowpack as it melts in the summer; climate change is decreasing mountain snowpack across the western US and the globe, leading to significant population displacement, disruptions in global trade, and contributing to armed conflict.
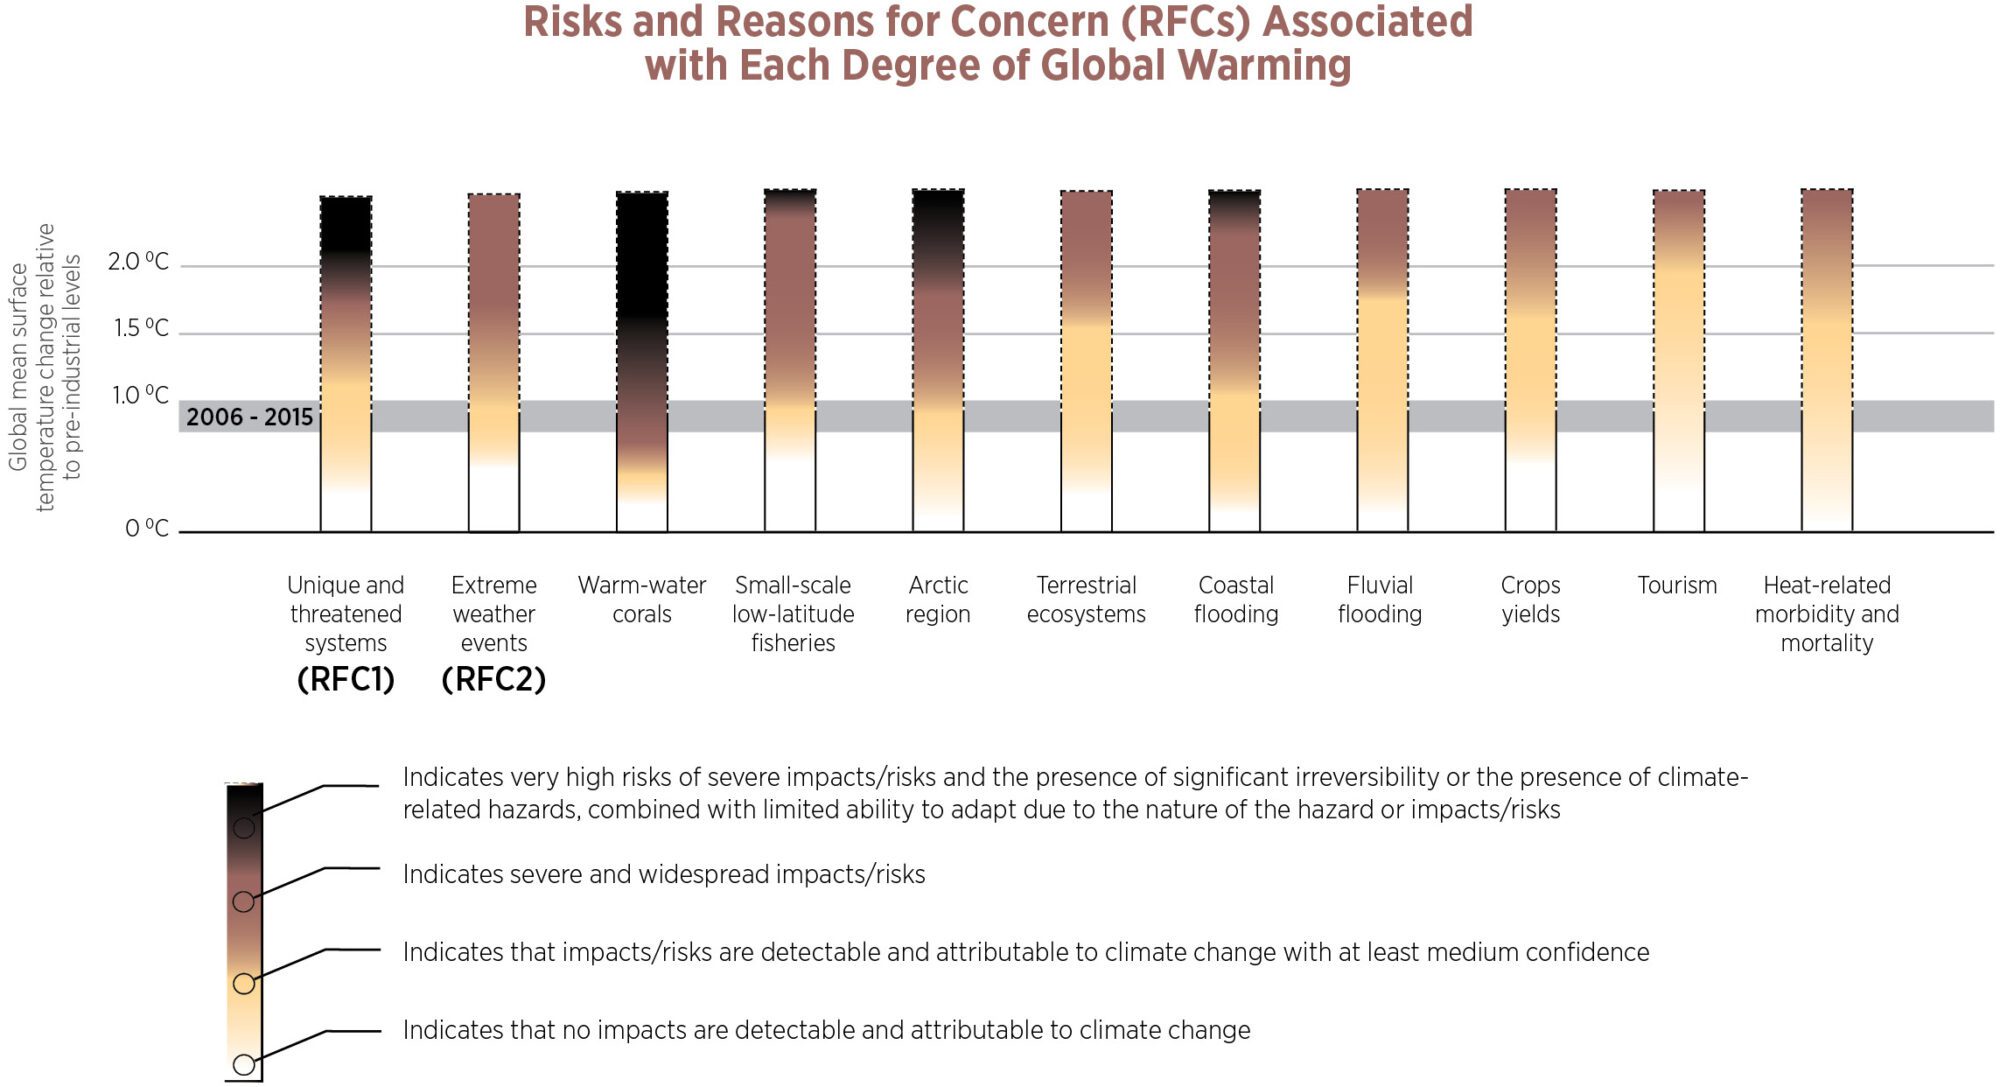
Risks increase with warming. This is a sample of some risks identified by the IPCC based on average warming scenarios. For instance, 99% of tropical corals are projected to be lost with warming of around 2.0C
Tipping points may occur at many scales, simultaneously:
- Melting permafrost not only releases additional methane from decomposition, it also reduces snow areas that reflect solar heat back into space.
- Ocean currents are based on seasonal temperature fluctuations. While we don’t know at what level of warming they may change, regional weather patterns would be drastically altered when they do.
- It is estimated that 99% of corals will die at 2.0°C. Since corals provide food and shelter for many species, this will significantly deplete fisheries around the world.
- Stressed ecosystems tend to emit more carbon than they absorb. For example, warmer winters in the Rocky Mountains have allowed the bark beetle to kill millions of acres of trees. Additionally, wildfires from stressed ecosystems provide additional carbon releases into the atmosphere.
(Almost) Everything in the Future will be lower Carbon
When LMN remodeled our office in 2014, carpet tile embodied carbon was responsible for nearly a quarter of the emissions. Eight years later, carpet tiles that are close to carbon neutrality are widely available. Significant carbon reductions across our industry are occurring in real time, driven by passionate materials scientists and our industry’s specification of lower carbon construction products and energy sources.
- Energy Use: a majority of the electricity production in the US is pledged to be renewable by 2050, still early in the lifetimes of any building or renovation being planned. With no national plans to decarbonize gas use in buildings at scale, only all-electric buildings have a path to get near zero emissions. The time of day and year that energy is used is of growing importance as the electricity grid includes more renewables; grid-interactive programs are addressing this to reduce the carbon intensity of energy use.
- Embodied Carbon: Energy use emissions reductions through clean electricity generation are also reducing the embodied carbon of electricity-intensive products. Building material manufacturers across our industry are engaged in research to reduce their embodied carbon by designing lower-carbon processes. Building owners, governments and design teams are working together to reduce their embodied carbon footprint by demanding these better products to reduce the carbon intensity of their portfolios. The free EC3 tool allows comparisons between construction products, allowing architects to find and compare products for their carbon intensity, spurring manufacturers to decarbonize their manufacturing process to be among the best on this platform. Dynamic LCA includes some future consideration. The RICS Carbon Assessment Guide 2.0 includes future projections of embodied carbon for use in LCAs (diagram in Post 07).
- Refrigerants: While many refrigerants have a Global Warming Potential in the thousands, CO2 has a GWP of 1, and new classes of refrigerants are being tested and used for different equipment, including A2L and A3 refrigerants. The MEP 2040 is doing research in this area, covered in Post 14.
- Carbon Sequestration is part of many IPCC scenarios, and generally refers to removing carbon from the atmosphere. It is an emerging field that includes carbon sequestered and stored by trees and plants, technical carbon capture from air, and an increasing number of building materials.
- Beyond technology, many companies and organizations are reducing their carbon pollution and are working toward carbon neutrality, bringing other companies along with them. The SEC requires companies to disclose their carbon risk. And many policies and regulations are also requiring carbon disclosure and reduction such as the Buy Clean policies and efforts of the Building Performance Standard Coalition.
Will we help drive each of these areas to decrease emissions quickly enough to keep us under 1.5°C? As leaders of the design and construction industry, we have an outsize influence in creating a low-carbon future directly through our design, specification, procurement, and advocacy. Each area will decarbonize at a different rate, of course, and some areas of the economy are going to be more difficult to decarbonize.
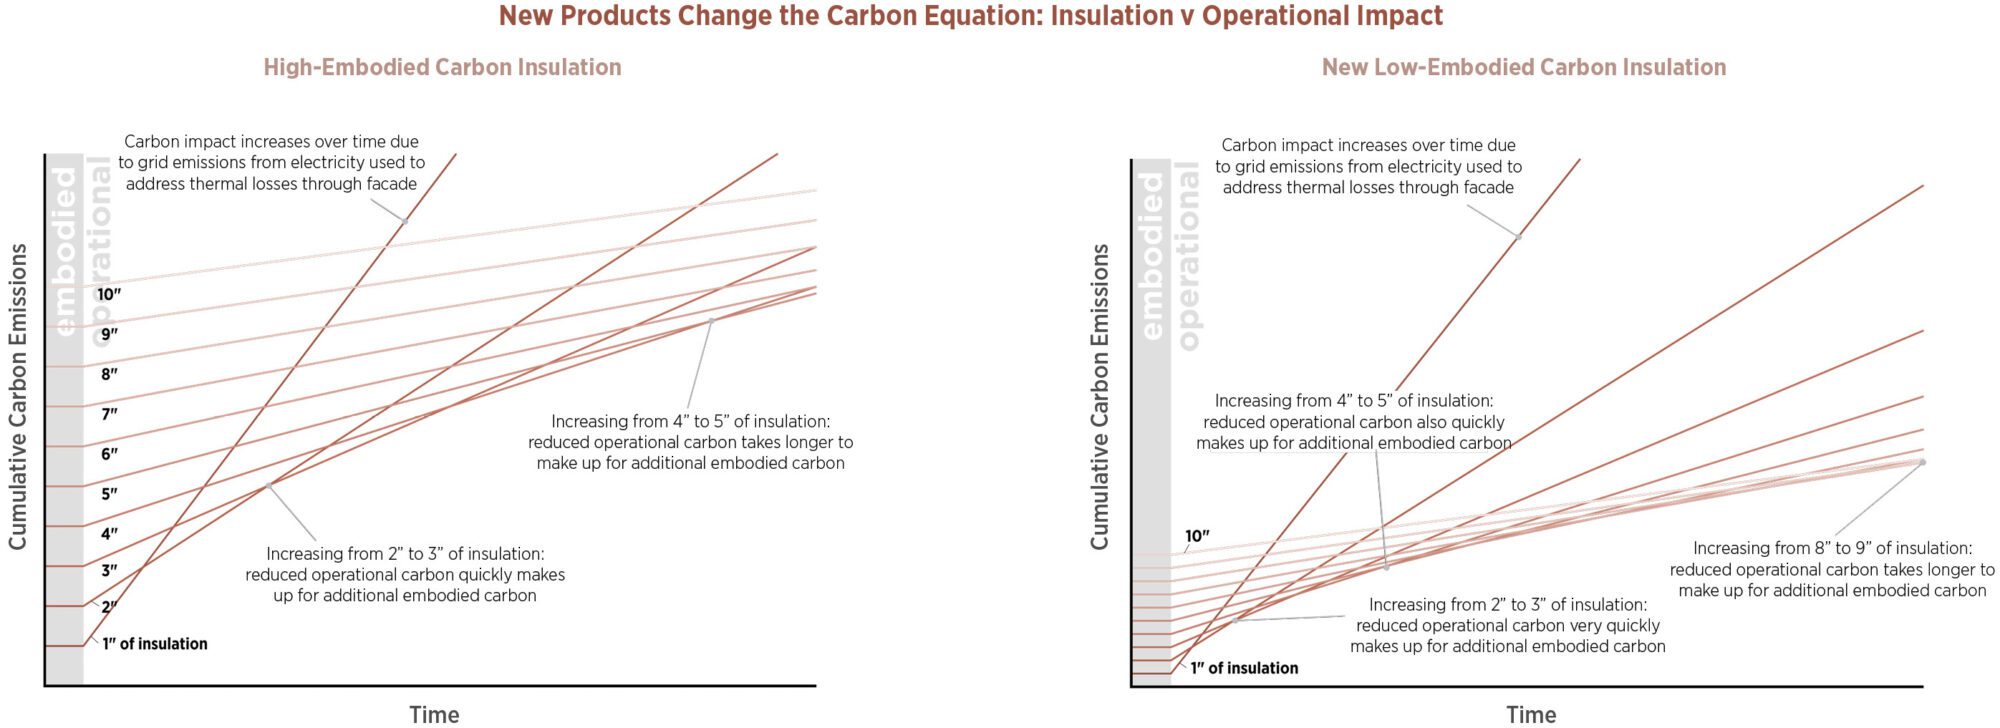
New lower-carbon products are changing our decision-making to reduce total carbon emissions. This These charts compares the initial embodied carbon with the operational energy use carbon impact due to heat losses through the façade. Rigid insulation products have historically had a long carbon payback but new products using improved blowing agents have drastically changed the equation, meaning additional insulation to reduce energy use is a carbon win more often than a few years ago. on the carbon payback of additional insulation. These charts do not include future energy use carbon reductions, embodied carbon reductions of mechanical components, or reductions in new off-site renewable energy induced by a new energy demand.
Living Within Our Carbon Budget: Time + Value
There is no universally accepted standard for valuing carbon emissions today against those in the future, though some guidance is emerging. All carbon emissions should be reported clearly and without weighting. For some decisions, perhaps comparing one renovation strategy to another, weighting emissions over time is useful, but a few general principles should be observed when doing so:
- Emissions today are more destructive than those in the future as they cumulatively warm the planet and oceans. We may have scaled-up carbon sequestration in the future, but the warming and harm caused until then may trigger increased warming tipping points. As discussed earlier, staying below 1.5° or 2.0°C is paramount to manage planetary risks.
- Carbon removed (or avoided) today is more helpful than carbon avoided or removed in the future. Since nearly everything in the future will be lower carbon than today, delaying any action (such as construction) or reusing products or buildings is very likely to reduce total emissions. Deep energy retrofits and other significantly energy and carbon reducing actions, however, should not be delayed.
- Future carbon removal is unproven and of questionable value. While carbon removal costs are expected to drop, technological carbon removal is unproven at scale and forest-based carbon removals are facing unprecedented wildfires and other challenges. Weighting today’s known carbon emissions against a future, unproven technology to remove them is not credible.
A few methods are available to weight emissions or emissions’ costs over time, however, but they are not standard and should be understood and disclosed. These can be useful when, for example, comparing the carbon impact of initial embodied carbon of an envelope system against the projected operational carbon from energy use over time. These are organized from simplest to most complex for project teams.
- Cost of Carbon/Carbon Damages. The use of a Social Cost of Carbon is simple: include the cost of each ton of CO2e emissions in design + procurement decisions. Note that the calculations that went into creating an SCC uses a discount rate that weights the cost of today’s emissions reductions against current and future economic damages. As noted in Post 01, many entities use different values for the cost of carbon based on different models. A recent paper suggests the damages from carbon emissions are around $185 per tCO2e.
- Carbon Simple Payback. How long does it take for a carbon reduction strategy to avoid or sequester the carbon it takes to implement it? Note that creating a baseline (counterfactual) is important – what is a reasonable condition if the team had done nothing additional, given policies and typical practices?
- GWP-20 v GWP-100. Most standards use GWP-100, or global warming potential of a gas over the first 100 years. However, some analyses use GWP over the first 20 years; using GWP20 emphasizes the importance of short-lived atmospheric gases, especially methane emissions, over long-lived gases such as carbon dioxide emissions.
- RICS future embodied carbon factors. Some modest estimates that the embodied carbon of some future products will be lower than those of today, meaning future replacement cycles are projected to have lower carbon intensity than the materials available today.
- Dynamic LCA. Prioritizes emissions reductions today. Part of France’s RE2020.
- Discount Rate. A discount rate weights costs of carbon reductions today against costs in the future and is a familiar tool within economic discussions. However, it can also be used to spuriously justify delaying carbon emissions reductions economically. It is controversial.
- Biogenic carbon storage value. Storing carbon over time has obvious value, but the calculations for estimating the value are very complex and not universally agreed on. Using temporary carbon storage, such as within carbon storing building materials. WBLCA rules suggest that biogenic carbon is released within the EPD modules studied, but nonetheless there is a time value to storing carbon in construction materials, even if only for 10 or 20 years. While there is debate about the calculations, LMN’s view is that future of today’s biogenic carbon-storing materials will also avoid releasing most of the carbon at the end of life.
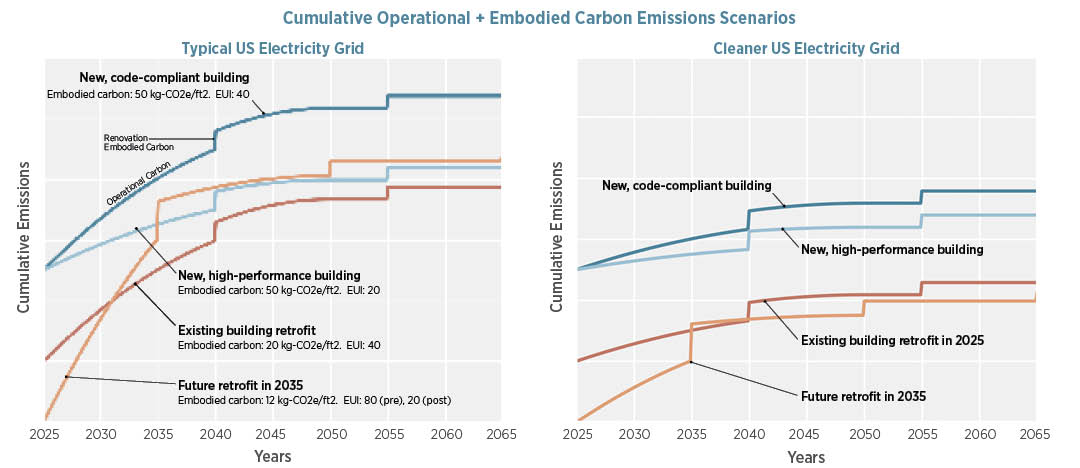
Cumulative greenhouse gas emissions including embodied and operational carbon for the four scenarios listed. Each includes a 15-year tenant improvements cycle with decreasing embodied carbon due to widespread new techniques and products. The electricity grid starts at 300 kg-CO2e/MWh (left) or 100 kg-CO2e/MWh (right), and is assumed to be 100% renewable by 2050, flattening the energy curves in the future. Energy renovations in high-carbon grids are more time-critical than those in low-carbon grids.
For practitioners, understanding the highly complex field of the time value of carbon is much less important than understanding immediate carbon reduction strategies. We also need to accelerate CO2e removals from the atmosphere for emissions that we can’t avoid.
For the cost of carbon, there are two main methods, with a third that combines them:
- Pay for damages now. The first post mentioned the social cost of carbon (SCC), which is a method of incorporating current and future harms caused by carbon pollution into financial calculations. If carbon is not expected to be removed by the polluter, this payment should be distributed to those affected by climate change for resilience and adaptation strategies.
- Pay for carbon removal now. We can also use the actual cost of removing the carbon from the atmosphere (ie, carbon sequestration). Technologies to remove carbon from the atmosphere (Direct Air Capture) are currently very expensive ($135-$340/tCO2e) and not scaled. Biological carbon removal (planting trees, for example) is an important part of the solution but cannot be scaled radically and has issues with wildfires and changing climate zones. Additionally, the carbon reduction from trees planted now will occur gradually over the next 100 years, which, while still beneficial, does not align with the timing of our current climate needs.
- Emit today, pay for damages, remove very soon. The first two can be combined if a robust bond or contract for near-future carbon removal is purchased. Any removals more than 5 years from the date of emissions should be questioned critically. The damages for the emissions could be prorated for the time they are in the atmosphere causing climate change, added to the bonded future cost of removal.
Incorporating a cost of carbon into project decision-making has several advantages. The cheapest carbon emissions reductions will be prioritized. In fact, all emissions reductions that cost less than carbon damages or removal will be incentivized and likely realized. These include many embodied carbon extraction and manufacturing reductions, operational energy use reductions, and more. The EC3 Tool, for example, allows a cost of carbon to be included when comparing bids. Carbon pricing policies are another way to incorporate carbon pollution into decision-making, with many types of policies implemented around the world.
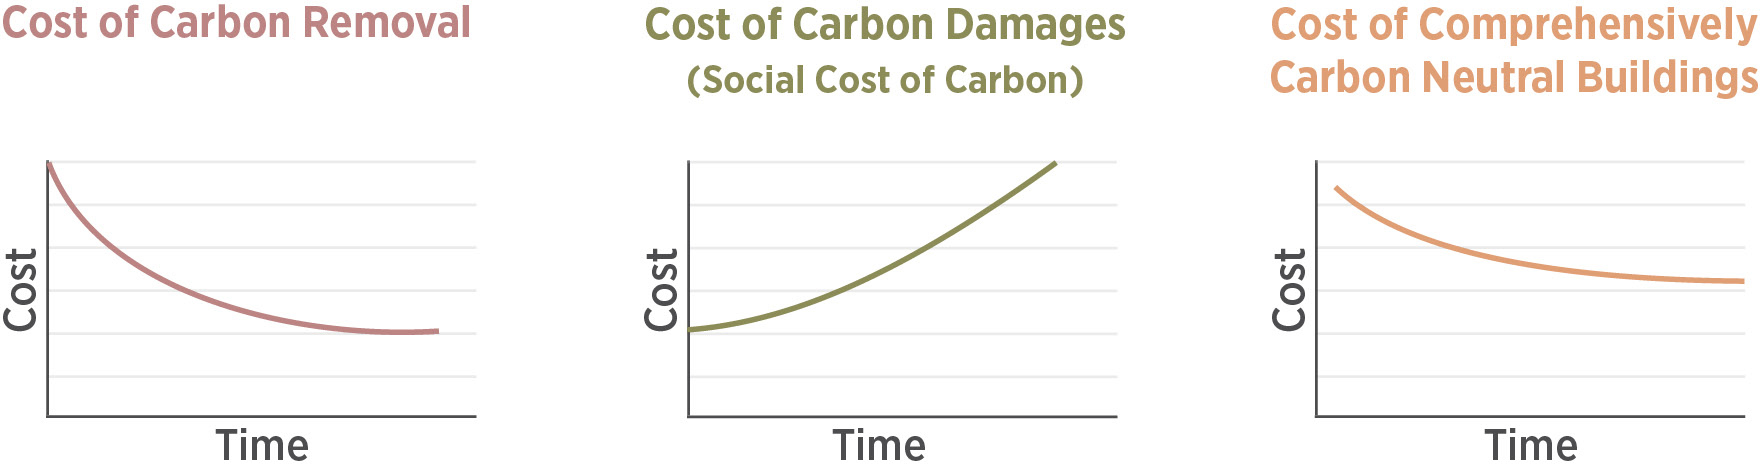
We anticipate that the intersection of these three time curves will determine the most cost-effective methods for climate action once low-cost emissions reductions are exhausted. The cost of carbon removal (including carbon-storing materials) is heavy in Research and Development now, and will come down in the future. The social cost of carbon (damages) will increase as our climate nears several tipping points, including the increased cost of constructing buildings and infrastructure that is resilient to climate change and sea level rise. Lastly, the cost of reducing carbon emissions is currently low but will increase as options are exhausted.
Conclusions and Recommendations
We understand many of the climate risks, we have a very small budget remaining, and we have very little time to act to avoid the worst consequences of climate change that occur above 1.5°C. The next three Fundamentals posts cover the major parts of the IPCC scenarios: Operational Carbon from energy (Post 06), Embodied Carbon (Post 07), and Carbon Sequestration and Removal (Post 08).
- Building reuse, product reuse, and delaying construction are clear carbon pollution reduction strategies.
- Using a realistic cost of carbon ($185/tCO2e, perhaps) is the simplest way of incorporating a time value into building industry decision-making. This means all carbon pollution reductions within a project that cost less than this are accepted.
Please email any questions or comments to Kjell Anderson, kanderson@lmnarchitects.com
Thanks to our external collaborators and peer reviewers
Phil Northcott, C-Change Labs; David Mead, PAE; Michelle Amt, VMDO; Alex Ianchenko, Miller Hull; Efrie Escot, Kieran Timberlake; Erin McDade, Architecture 2030; Indro Ganguly, University of Washington; Jack Rusk, EHDD
LMN Architects Team
Huma Timurbanga, Justin Schwartzhoff, Jenn Chen, Chris Savage, Andrew Gustin, Kjell Anderson
Posted: 10/14/2022
Edited: 12/08/2023
Edited: 09/30/2024
The text, images and graphics published here should be credited to LMN Architects unless stated otherwise. Permission to distribute, remix, adapt, and build upon the material in any medium or format for noncommercial purposes is granted as long as attribution is given to LMN Architects.