#pathtozerocarbon, #sustainability
06 – Buildings, Energy Use + Carbon
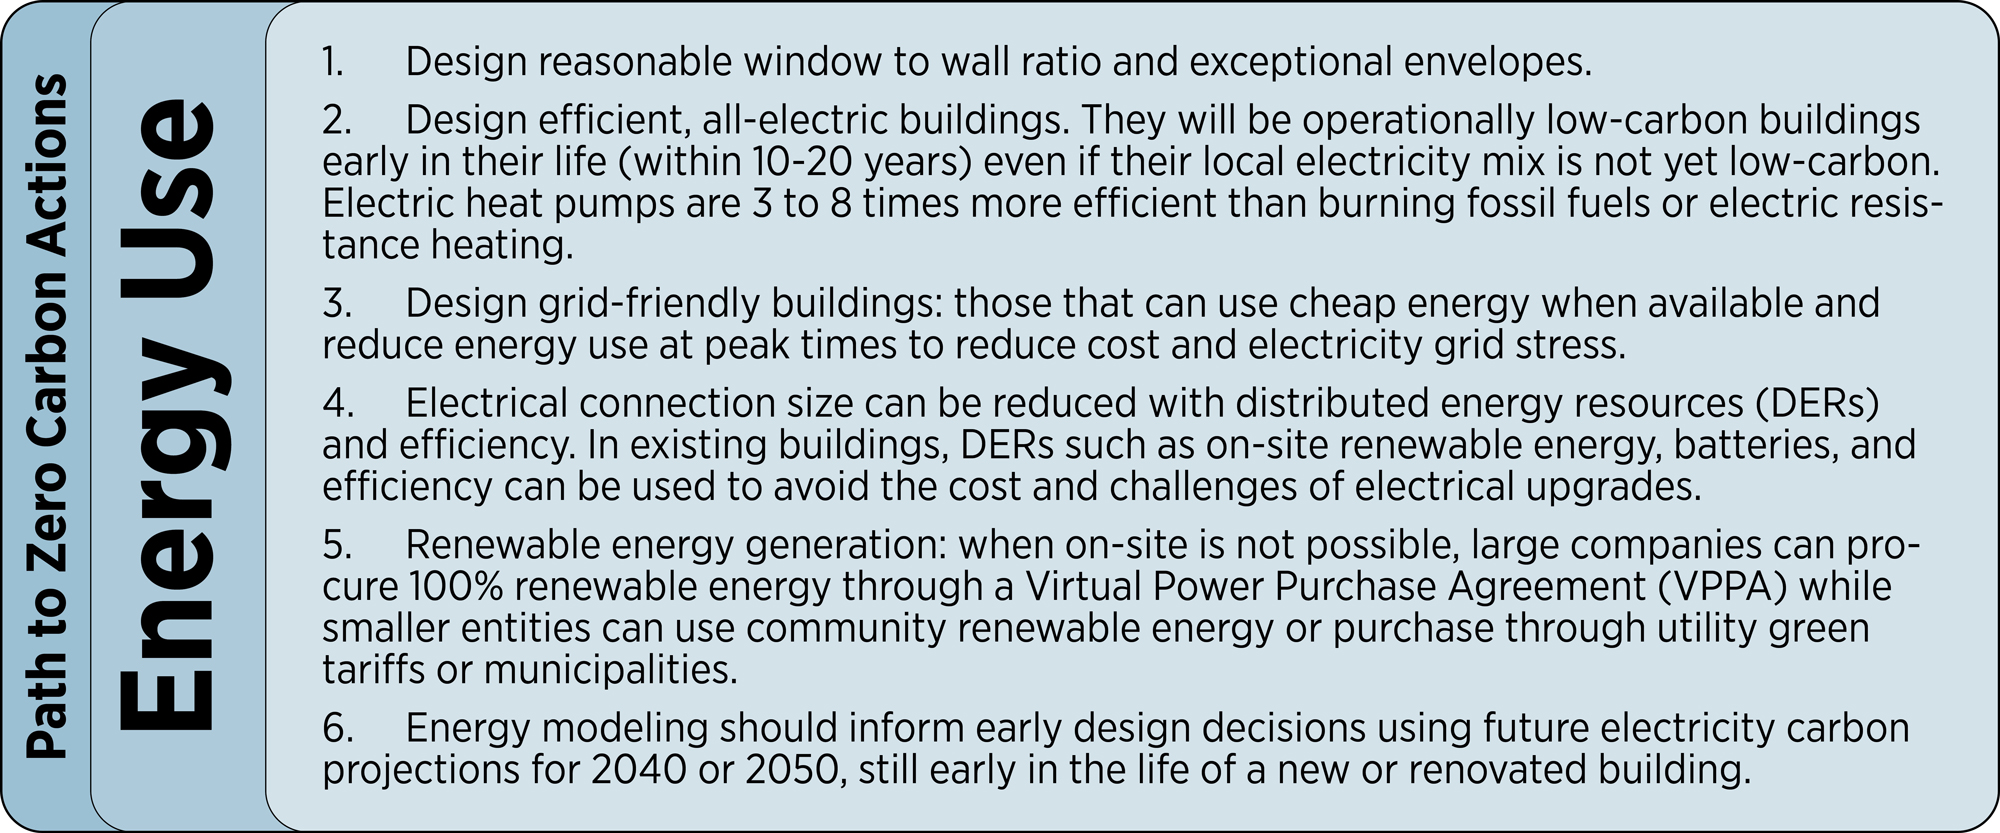
Net Zero Energy Use ≠ Net Zero Emissions
The design and construction industry has rightly focused on energy use reductions for decades: our clients pay directly for energy consumption, and it has been a good proxy for operational carbon pollution. However, with the necessity of carbon neutrality we now need to also understand carbon, and demand that the energy supply also meets our clients’ needs. Since roughly three-quarters of electricity is used at buildings in the US (and more is likely as EVs become commonplace) we need to have a commensurate voice in the supply of low-carbon energy sources.
It is nearly impossible to consume only renewable energy at all hours of the year at scale, a basic requirement for carbon neutrality. While many corporations are buying 100% renewable power on an annual basis, a handful of companies are trying to match the time of day that renewable energy is generated (and purchased) to the same time that energy is used in each market, currently a very challenging goal.
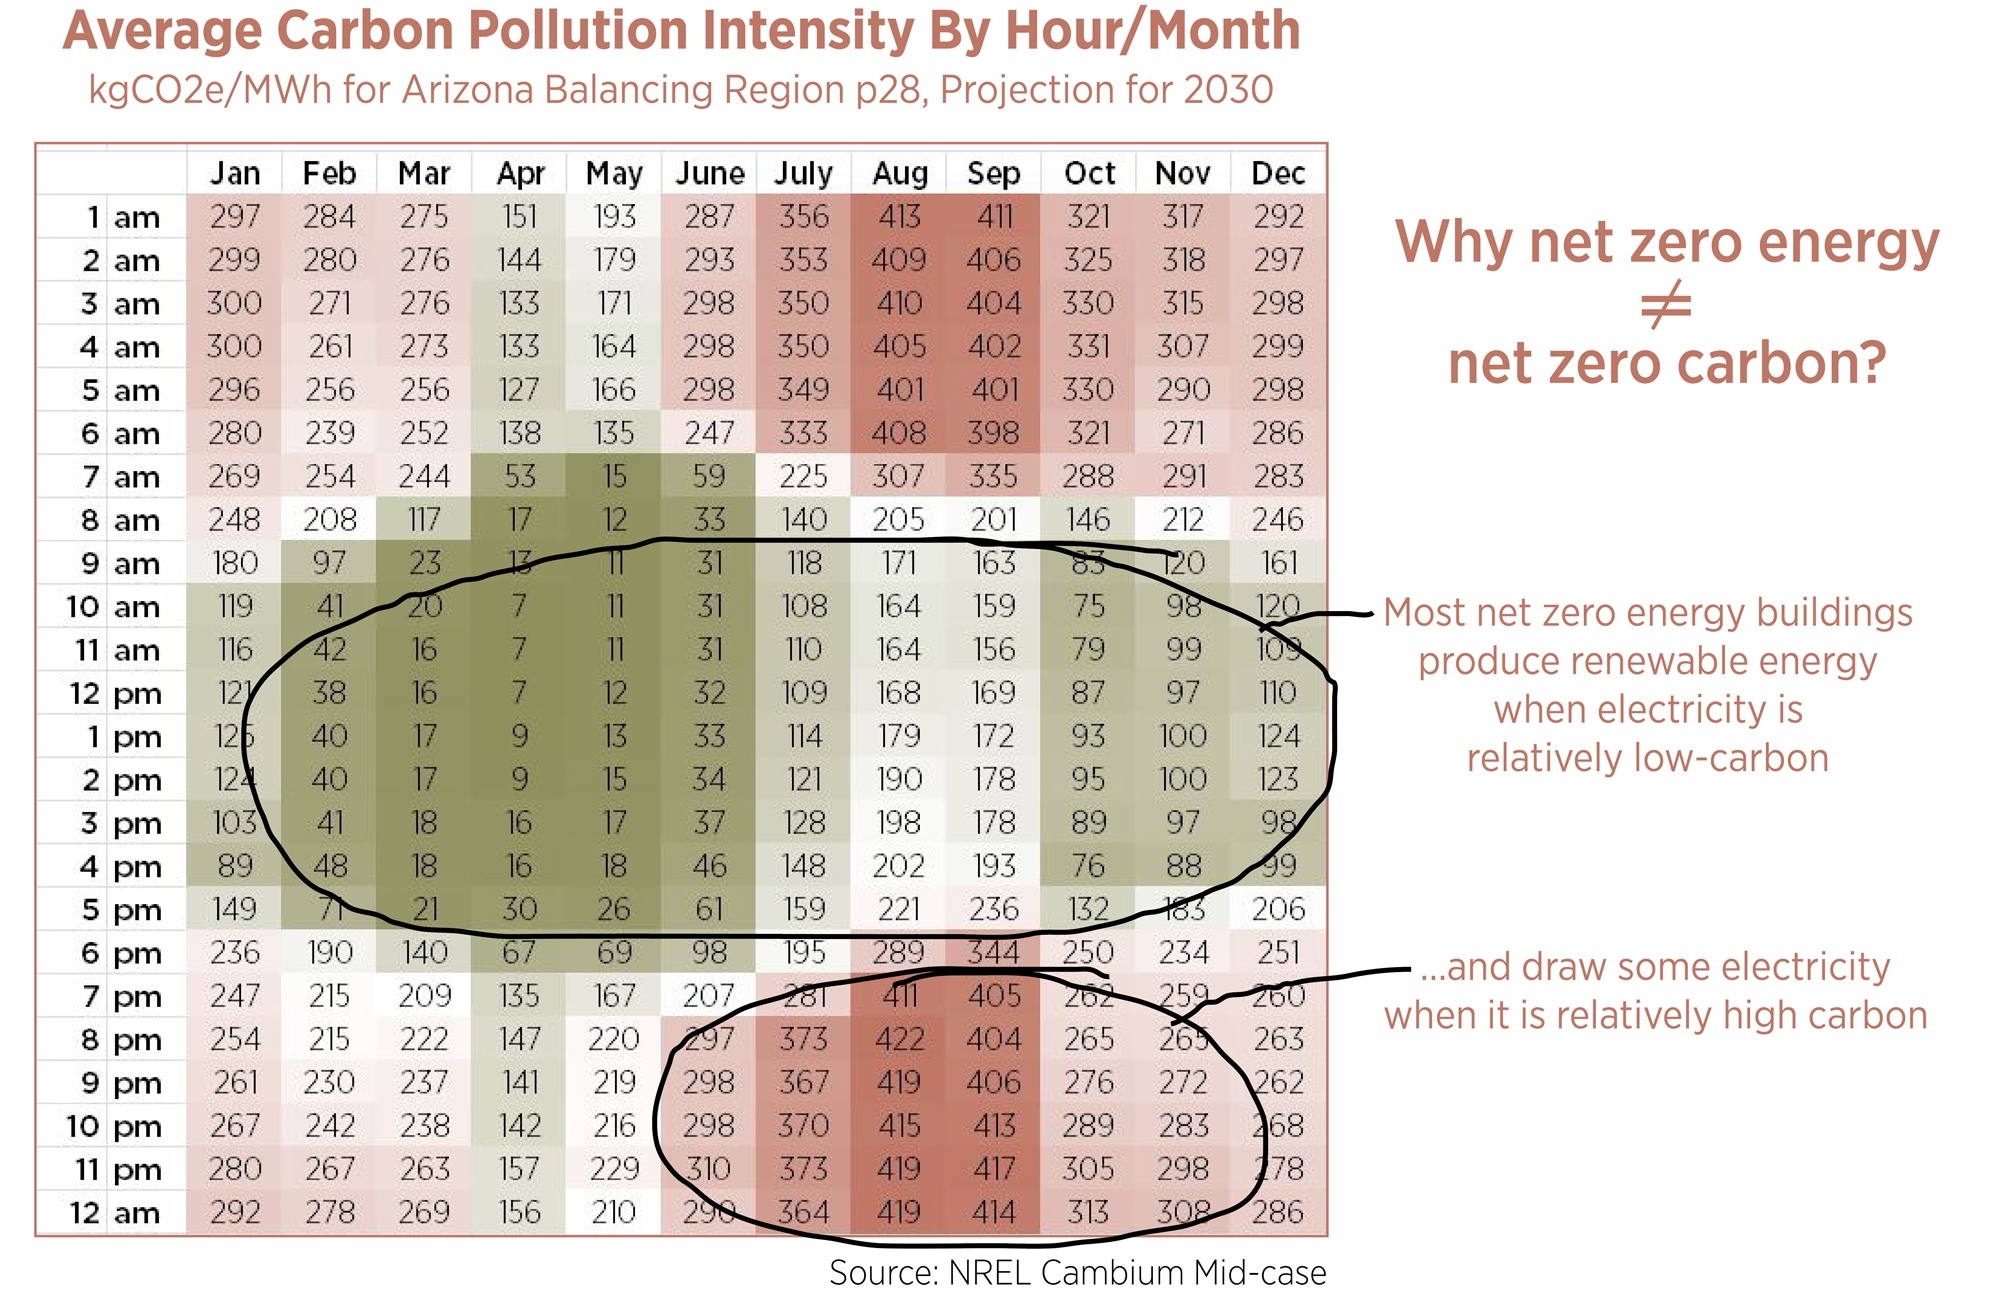
Estimated average electricity carbon pollution intensity for central Arizona in 2030 by hour and month. Net zero energy balances energy used and energy generated, but this does not lead to operational carbon neutrality. Net zero energy projects over-generate electricity when carbon pollution intensity is low, but draw electricity from the grid at other high-carbon times. While the annual energy balance to zero, the carbon numbers do not. Grid-scale batteries are being deployed to help moderate this.
While our industry has gotten proficient in addressing energy, as we close in on carbon neutrality, we now need to understand both energy and carbon pollution for a variety of reasons:
- Many building owners are demanding carbon pollution reductions that we can deliver if we understand carbon and buildings.
- The enormous impact of embodied carbon is now well understood; it can be a majority of 30-year carbon pollution from buildings in clean electricity grids. Tradeoffs between operational energy carbon and embodied carbon are being asked for by owners and are on the horizon in codes, standards. Embodied carbon starts in Post 07.
- Energy codes, technology and design have driven down building energy use significantly per square foot area. AIA 2030 Commitment Reporting shows a change in average projected energy use reduction from 35% better than an existing building (2010) to 55% (2024), across 4.4 billion square feet. EIA data shows the average building in the US – including existing and new – has been reduced by 22% between 2003 to 2018, primarily through energy codes and LED lighting retrofits.
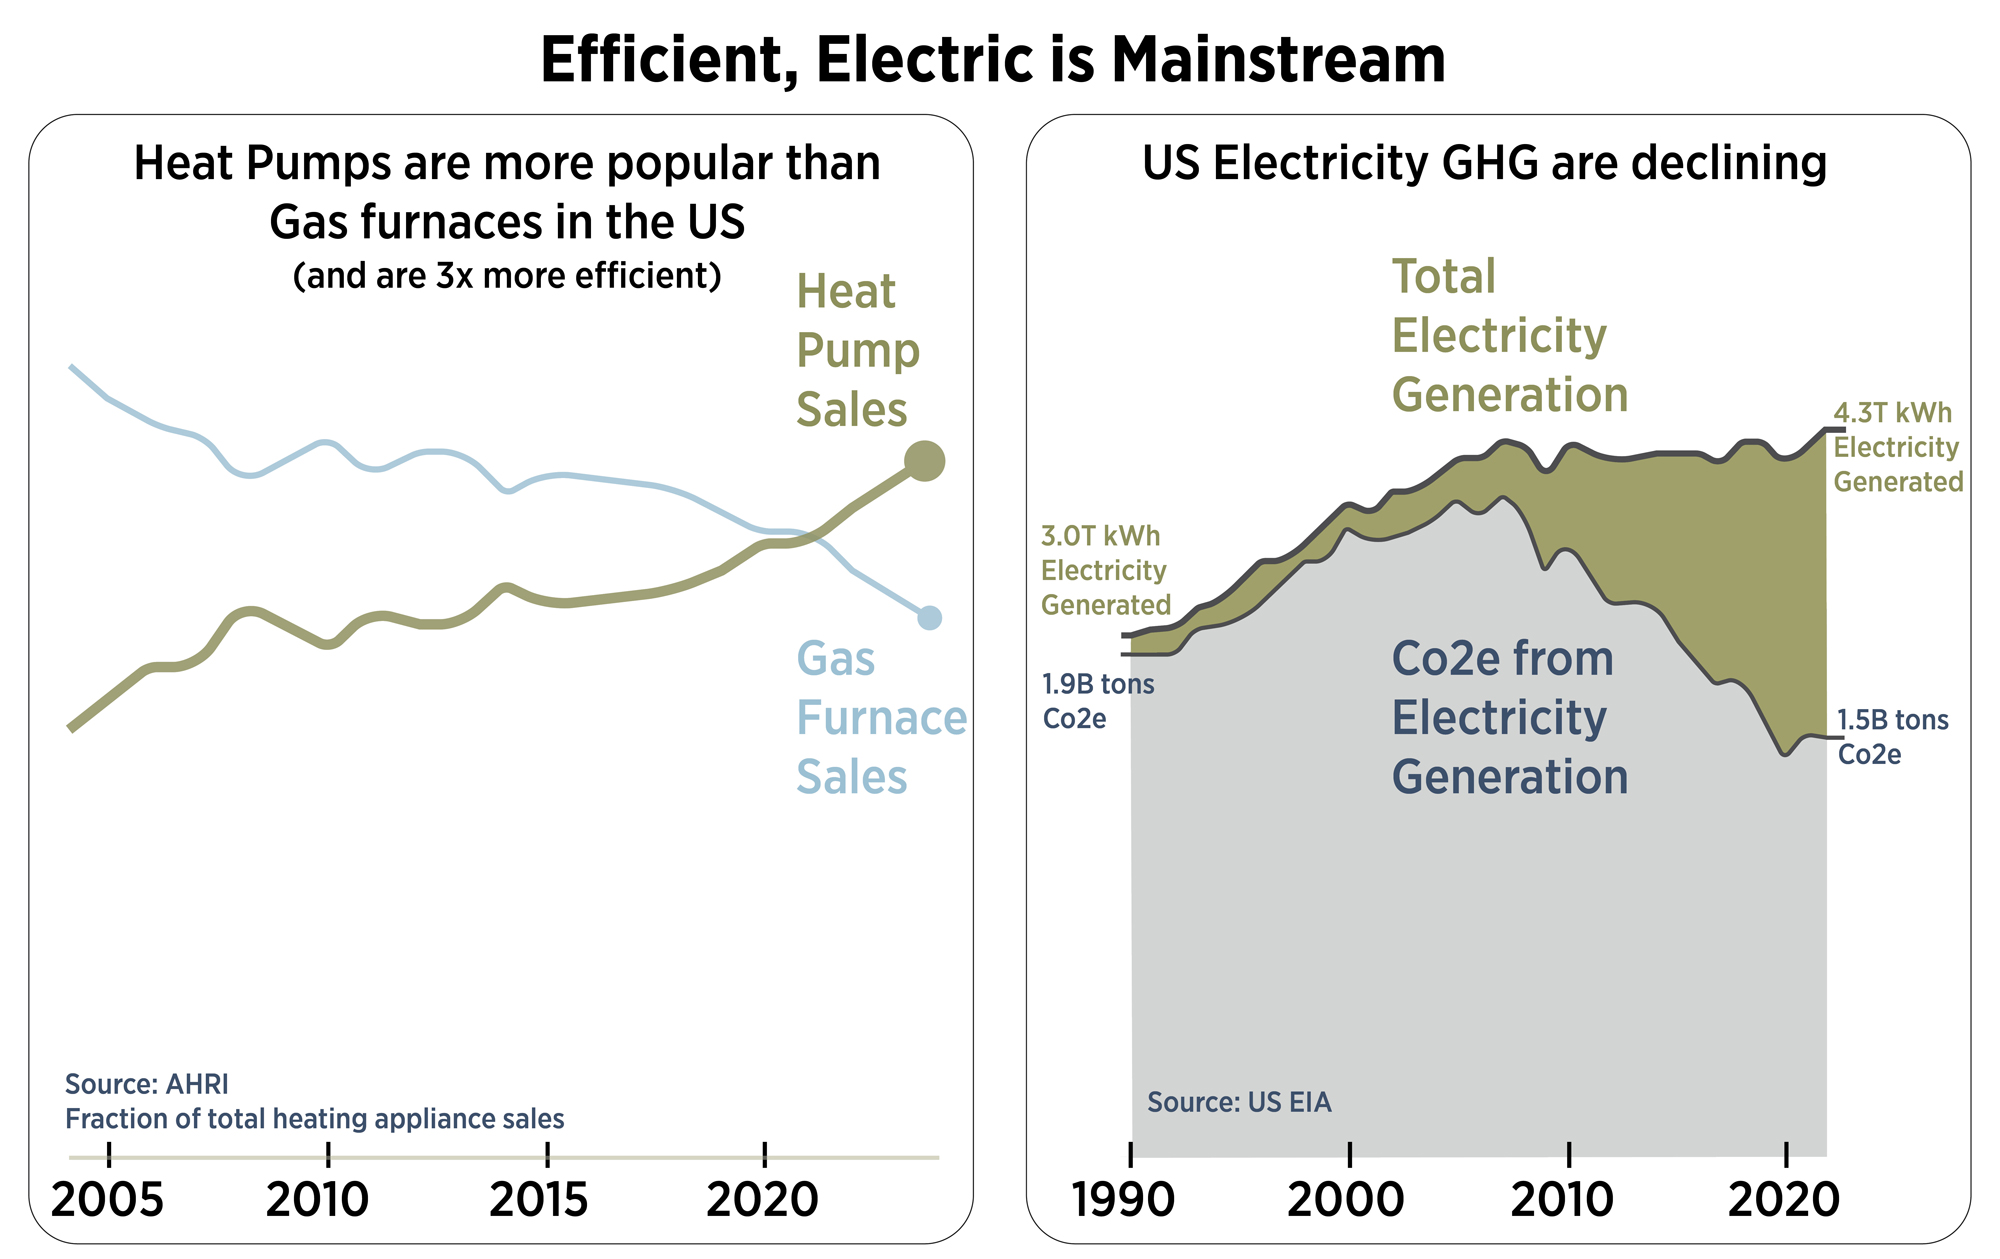
- Electricity generation is getting cleaner in the US and worldwide, with 10 countries supplying 99.7% or more of their electricity through wind, water, or solar energy. This means that electrification (even if the grid is dirty now) and avoidance of fossil fuels is the clear path to low-carbon design.
- Renewables are generally the lowest-cost source of energy generation, partly since there is no fuel cost to run them. Renewables are often intermittent, meaning that the carbon pollution from electricity varies throughout each hour, day, season, and year. Using electricity during low-carbon times is an important decarbonization strategy. States with more renewable energy tend to have lower electricity costs. California is the exception; most of the electricity price increases there are due to transmission and distribution costs and several other reasons that do not have to do with a high percentage of solar.
- New electricity generation is mostly renewable energy that relies on intermittent solar and wind. This means that carbon pollution from electricity varies hourly based on climate conditions. A low-carbon building not only uses less energy, it draws energy at the right time of day when renewable energy is being produced.
- Reduced electricity through building energy efficiency decreases the cost of the renewable energy transition and frees up electricity for transportation and industry.
- Many low-energy HVAC systems leak refrigerants with high global warming potential, partially offsetting their advantage, so we need to translate this into carbon equivalent emissions to make sophisticated decisions.
- Building Performance Standards are requiring energy or carbon pollution reductions in existing buildings.
- Total US electricity demand is expected to increase dramatically (perhaps 2.5x current generation by 2050) to accommodate electric vehicle adoption, new data centers that include artificial intelligence, re-industrialization or on-shoring of manufacturing in the US, as well as building electrification.
- Batteries are being installed rapidly at the utility scale, using excess renewable energy to serve peak demand and times when renewables are generating less energy.
Electricity v On-Site Fossil Fuel Combustion
While about half of the electricity in the US still comes from fossil fuels, this is quickly changing. Over half of the country’s electricity is committed to use 100% renewable energy by 2050. This matters less since nearly all new generation added to the grid is renewable solar or wind due to their low cost. Note that renewable energy has many different definitions. For this series, we consider wind, hydro, solar, geothermal, and biomass to be renewable energy. Nuclear is not renewable but provides largely carbon-free energy.
While the average carbon pollution intensity of electricity will decrease, on-site combustion of fossil fuels like natural gas are not expected to reduce their carbon intensity significantly over time. In fact, natural gas pollution is often underreported since it often doesn’t include potent methane leaks at wellheads and from gas pipelines.
While the hydrogen economy has been hypothesized for decades, it is unlikely to impact many buildings. Unfortunately, most gas pipelines and end use equipment are not able to handle hydrogen without significant modification, cost, and risk. Hydrogen will play a role in a carbon-free economy, but the highest priority for green hydrogen is not likely at the building scale but as industrial feedstocks. Renewably harvested gas, from landfills and waste decomposition, is likely to be prioritized for transportation as it is lightweight and can fuel freight vehicles more easily than current batteries, or as industrial feedstocks, and not added at scale to gas pipelines. Put simply, efficient, all-electric buildings will trend toward zero carbon while buildings that consume fossil fuels on site will not.
This post is primarily about electricity-related carbon pollution for two reasons: 1) carbon pollution from fossil fuels are fairly straight-forward to calculate, (although they often exclude upstream pollution) and 2) the lowest cost path to a carbon neutral built environment is based on widespread efficient electrification and the elimination of fossil fuels in most applications.
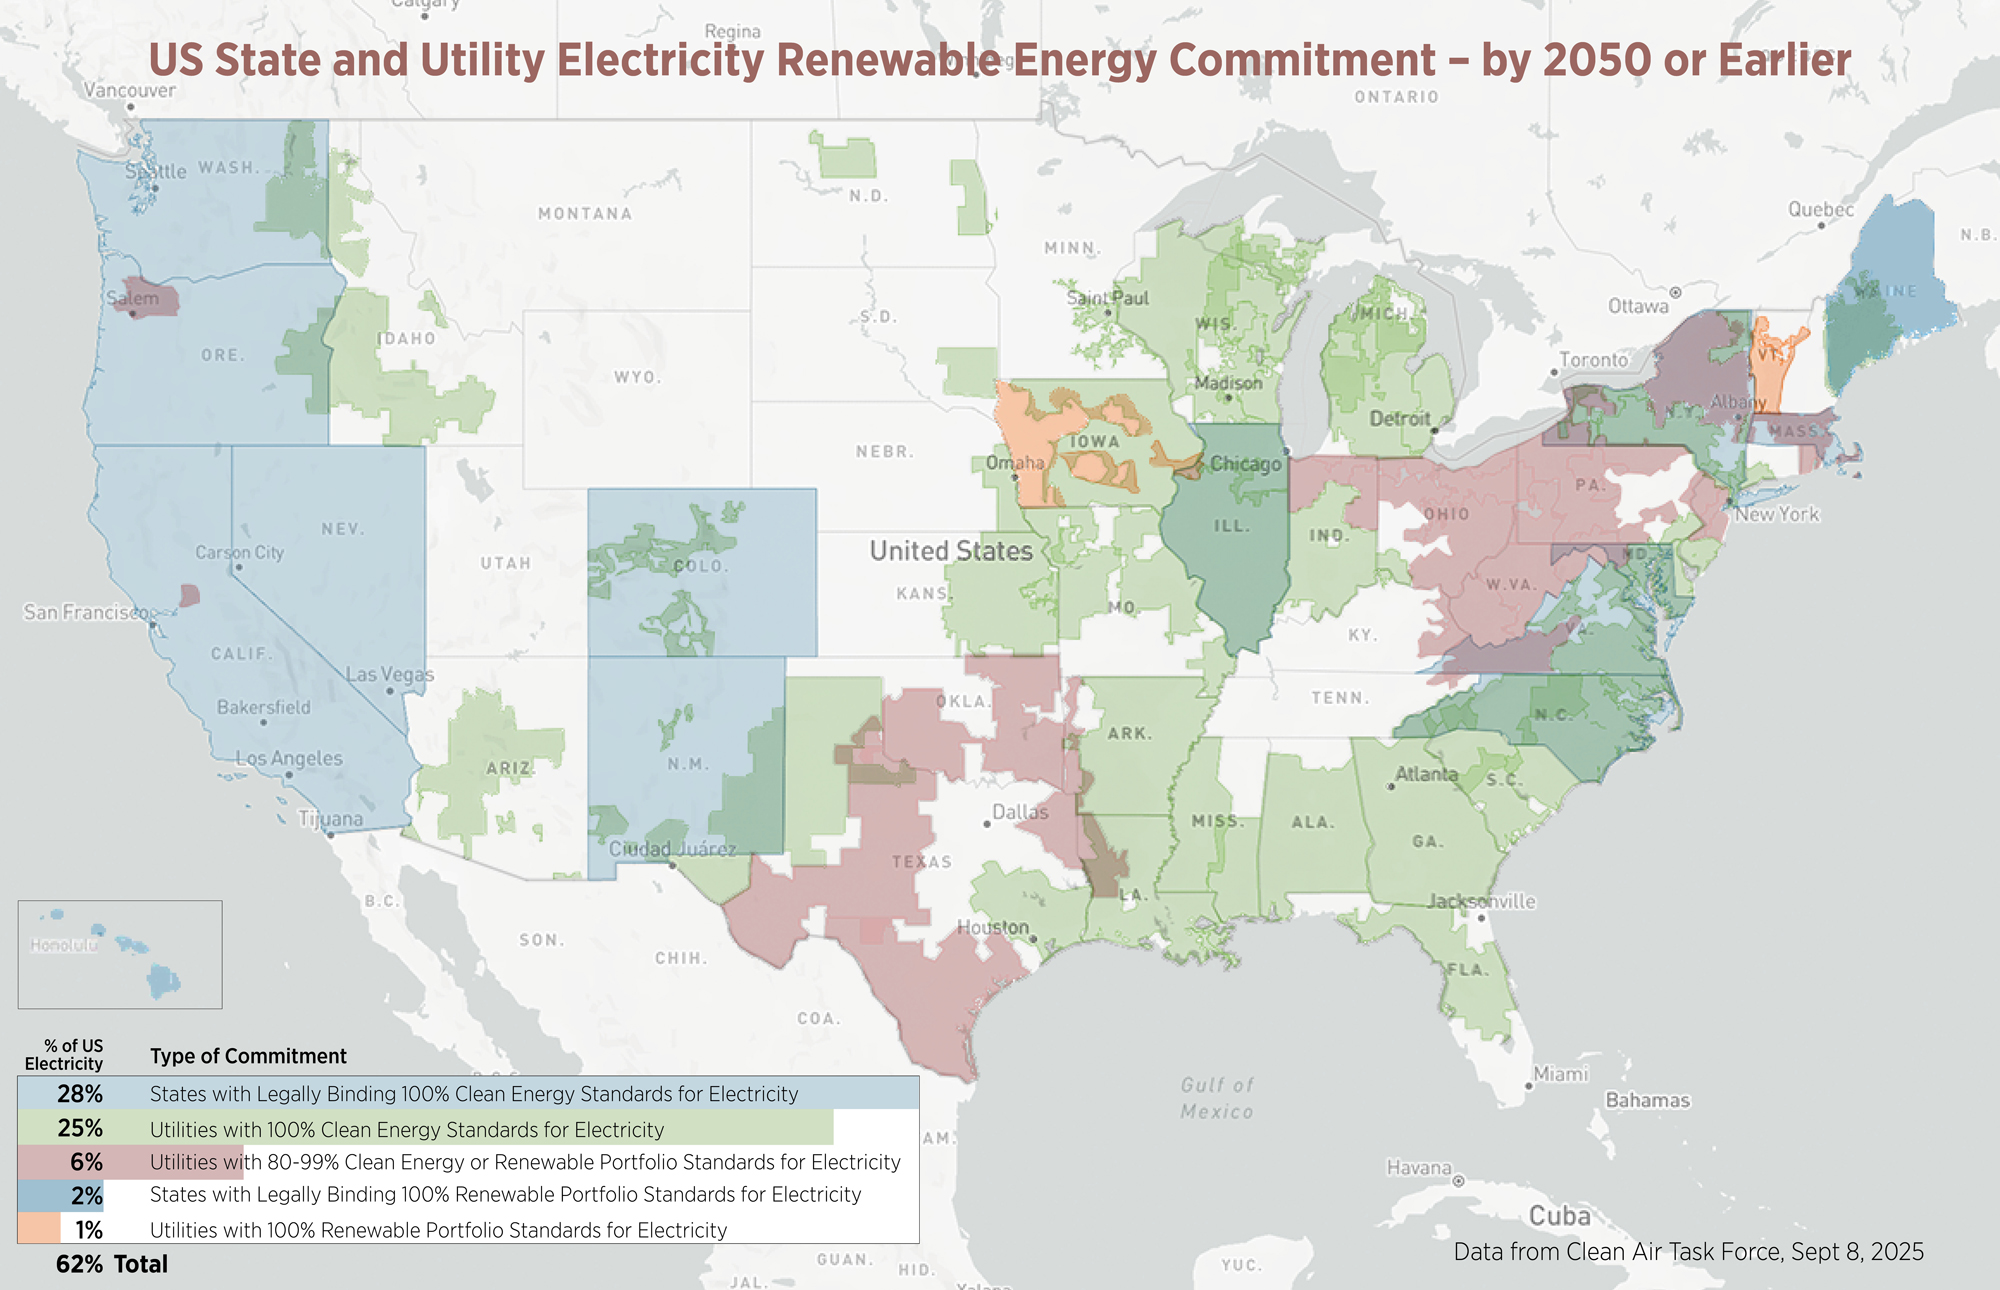
Over 50% of US energy supply is required or committed to be 100% renewablebefore 2050, still early in the life of any building designed today. Another 10% of the grid is committed to 80% renewable by 2050 as well. Renewable energy is now the lowest-cost new energy source in much of the US.
Where does my Electricity come from?
While we sometimes talk about the US electricity grid carbon pollution, the grid is not managed on a national scale. Instead, there are roughly 66 balancing authorities, and many of these manage electricity transmission and wholesale markets through larger entities called Regional Transmission Organizations (RTOs) or Independent System Operators (ISOs). Markets have numerous participants that engage in a complex dance that determines which power plants are turned on, off, and up or down. For example, when electricity demand is high in one area, additional power can be generated or purchased from other nearby entities. Electricity is also generated and managed from privately owned solar and/or batteries; one analysis shows the lowest cost electricity grid has a substantial amount of rooftop solar.
At a larger scale, there are three major grid regions in the continental US and lower Canada: the Eastern, Western, and ERCOT (Texas) Interconnections. They are largely independent, and only very limited amounts of power can be transferred between the three regions. Since much of the west is not under an RTO or ISO, the Western Interconnect also includes an Energy Imbalance Market as a real-time power market to reduce cost and carbon that spans many balancing authorities. An annual report on utility decarbonization is here.
New renewable energy generation often requires upgrades to electricity transmission lines since renewable energy is location-dependent. This interconnection queue is one of the larger challenges in deploying new renewable energy: over 2,000 GigaWatts of planned new generation (95% renewable) is awaiting transmission connection approval; for comparison, this planned new generation is roughly double the amount of current generation capacity in the US.
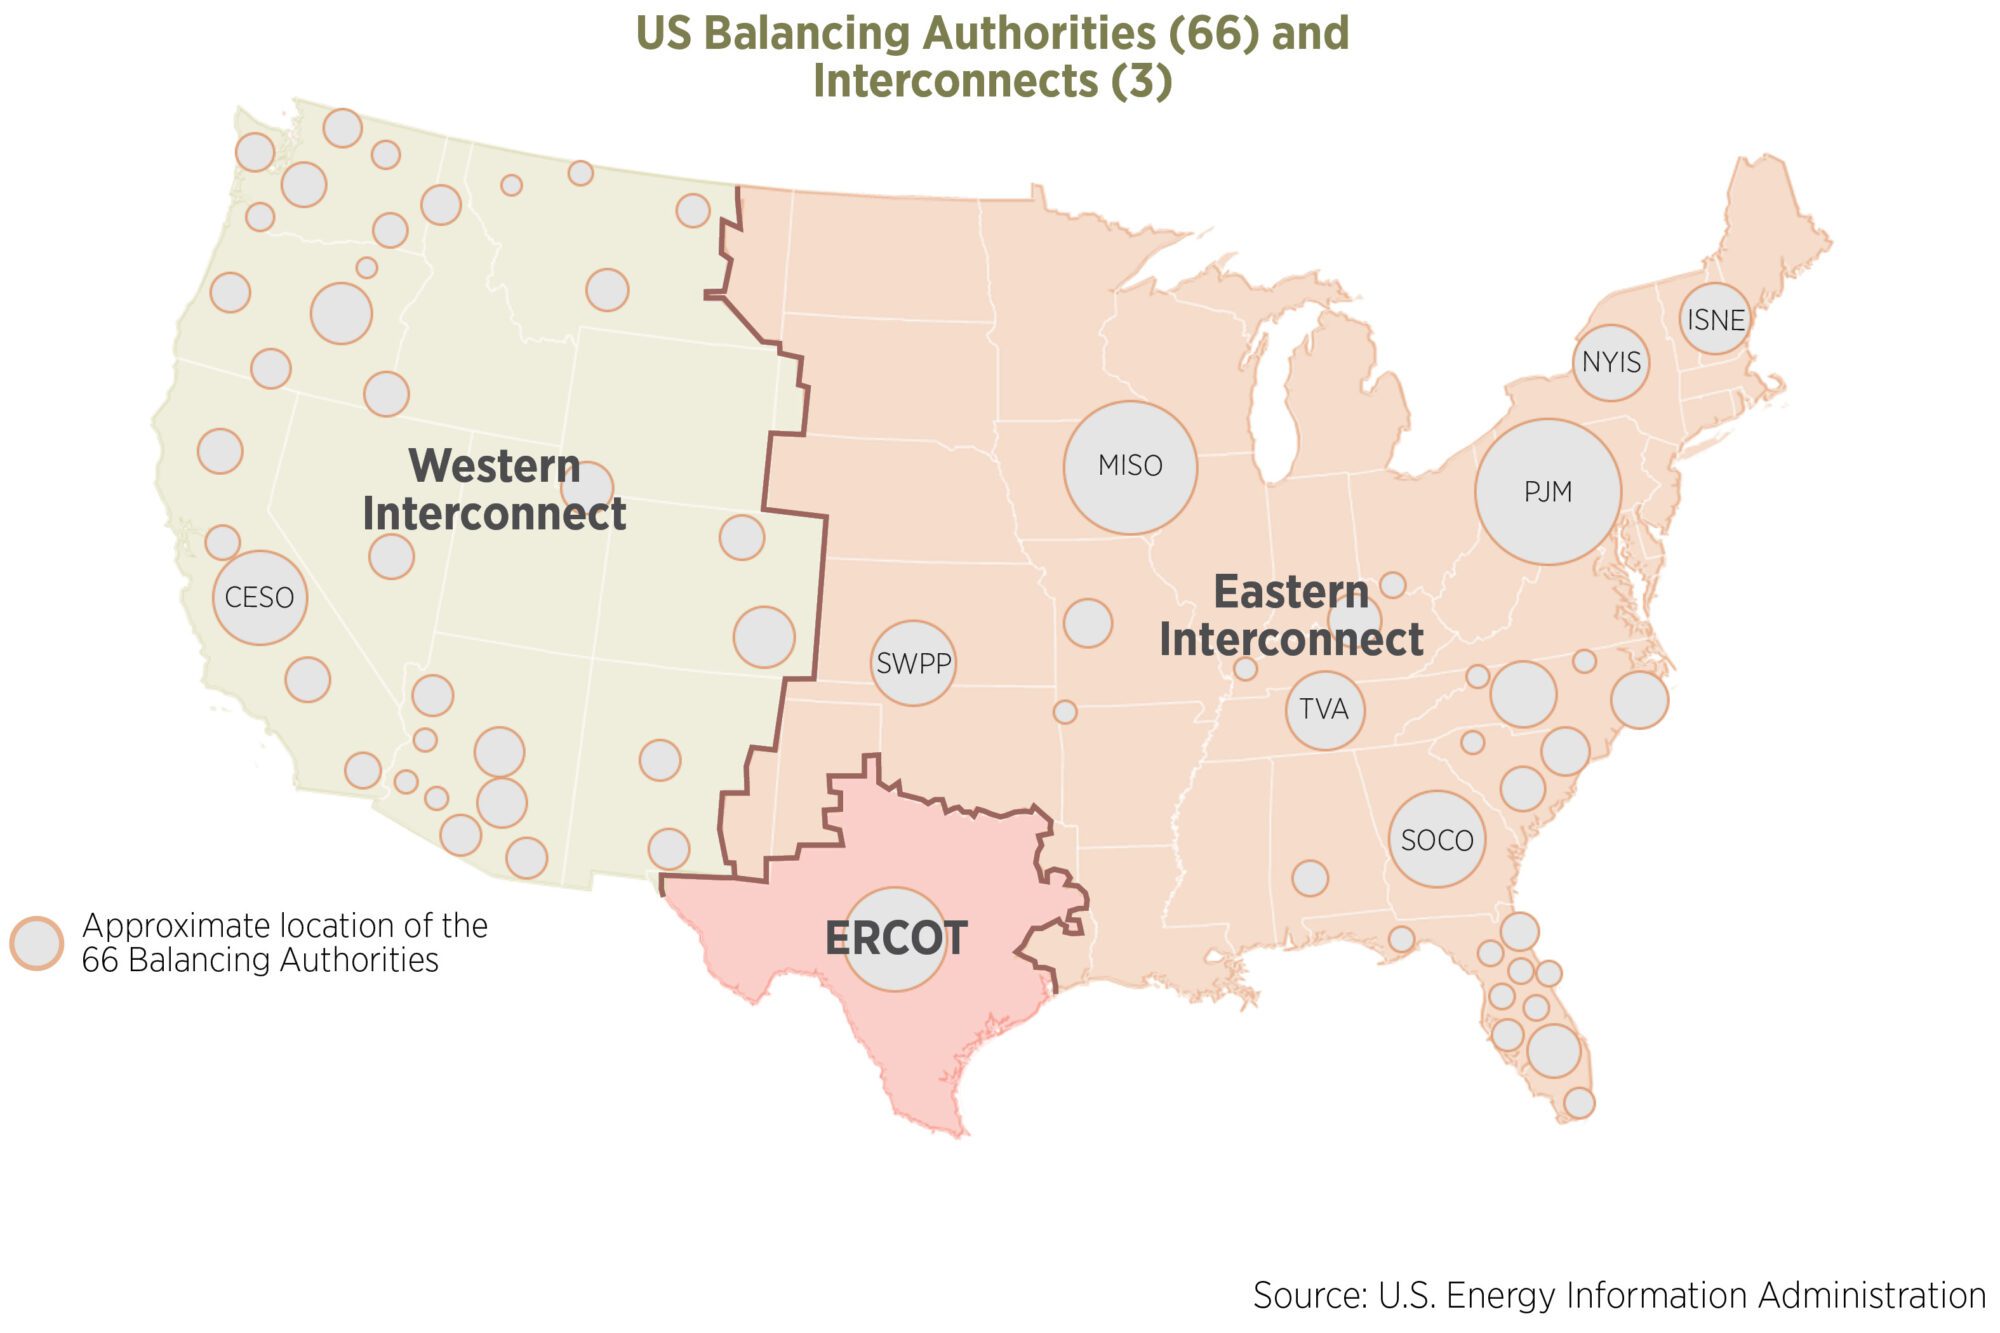
The US electricity sector has many scales: There are 3 largely independent ‘Interconnects,’ made up of 66 balancing authorities and other entities that manage power regionally; they determine which power plants will be turned on to generate electricity and trade with one another to maintain the right amount of electricity supply to meet demand.
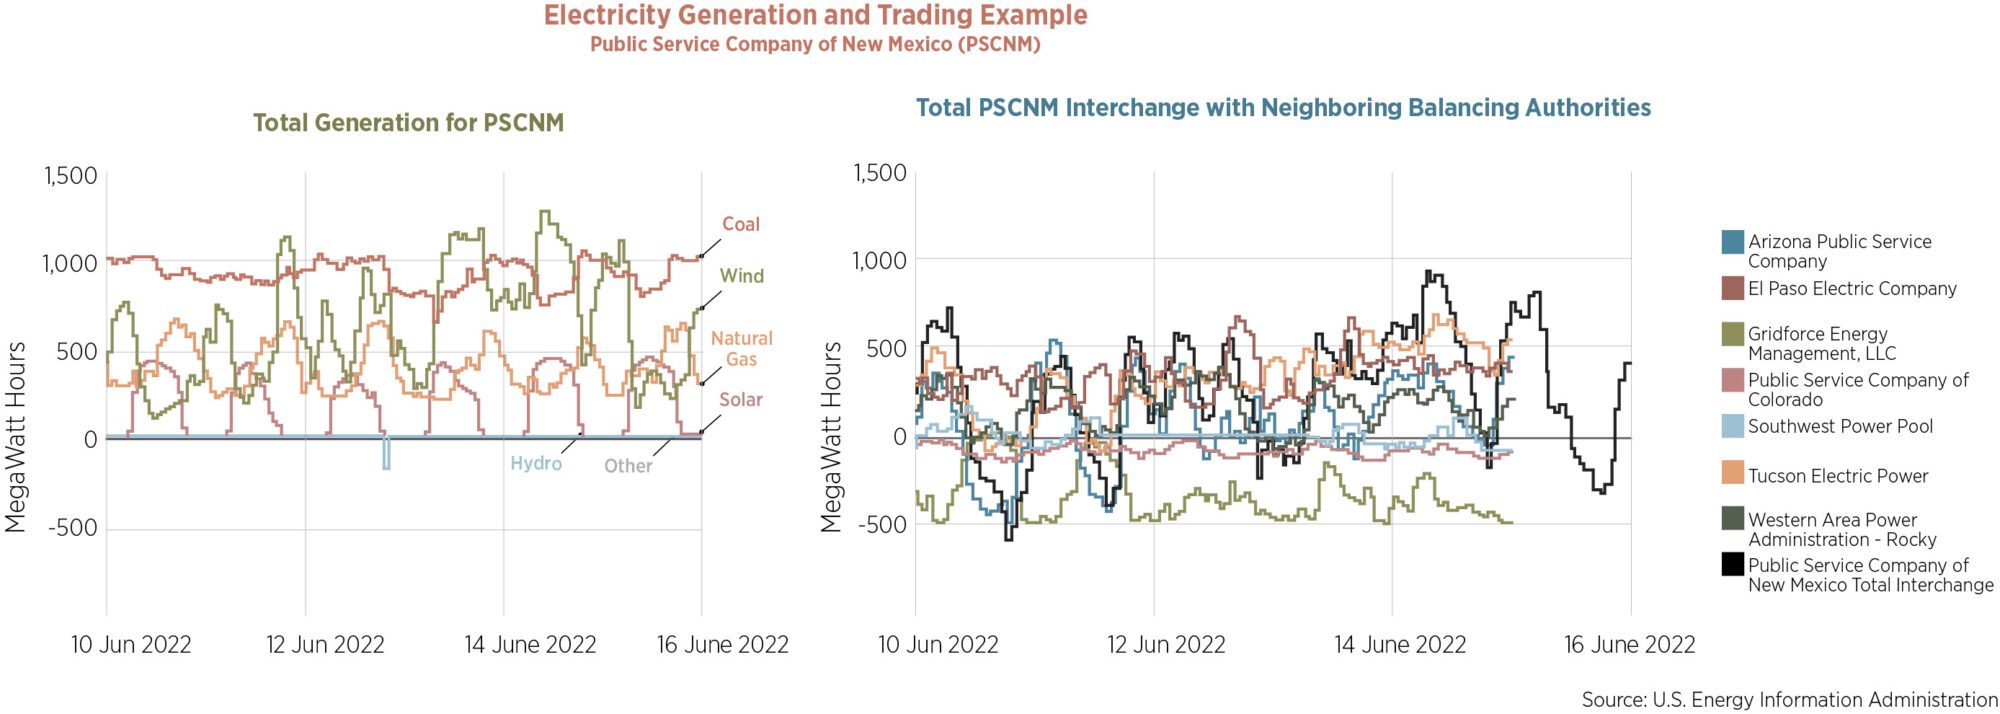
One balancing region – the Public Service Company of New Mexico – shows the varying generation over 6 days (left graph), with solar, wind and gas generation varying significantly throughout each day. The right graph shows the complexity of electricity being traded with other nearby balancing authorities throughout each day to maintain the right electricity supply. Data from these two graphs informs actual hourly carbon profiles.
An increasing number of buildings owners are buying off-site renewable energy, often through contracts like Virtual Power Purchase Agreements (VPPAs). Since renewable energy, once built, has no direct fuel costs, a long-term arrangement for 100% renewable energy can be cheaper than buying energy from the utility. The location and type of power being generated through these are important to the carbon pollution from a project, as we see in the next few sections. It’s called a ‘Virtual’ PPA since the generation is not uniquely tied to the buyer’s load, even though the generation (and RECs) are owned or directly contracted by the buyer.
How the Grid Generates Electricity: Baseload, Intermittent, and Dispatchable.
The mix of energy generation deployed often depends on cost, and since renewable energy has no operational fuel costs they are the cheapest resource when they are available. Data analytics, including weather forecasts, help project the minute-by-minute energy use days ahead of time to match demand with supply. An EIA map of all US generation and transmission is here.
- Baseload generation typically runs full capacity 24 hours a day, and can take around a day (coal) or a week (nuclear) to turn on and off. As intermittent renewables become more common, baseload generation is becoming less prevalent. Common types: Nuclear, Coal. Geothermal and Hydro are sometimes used as baseload resources.
- Intermittent generation runs whenever weather conditions are powering renewables (primarily solar and wind). This type is very cheap to operate since there is no fuel input, so fossil fuel generation is often turned down or off when renewables are generating electricity. At scale, intermittent generation requires electricity storage, a transmission network that supplies a large geographic region, or dispatchable generation, or to maintain grid consistency. Sometimes renewable energy cannot be used or stored, called curtailment. Common types: Solar, Wind.
- Storage is useful both at the utility-scale and at the building scale. Excess intermittent generation is often paired with battery storage to provide clean energy during peak demand times when expensive dispatchable generation would otherwise be turned on. Common Types: Pumped Hydro and Utility-scale batteries. Electric vehicles and building-scale batteries can also provide electricity storage but are not yet widely deployed to be influenced by grid operators.
- Distributed Energy Resources (DERs) include smaller scale renewable energy, batteries, and grid-responsive appliances, sometimes aggregated as Virtual Power Plants, which are beginning to be supported by some policies. Millions of DERs are already deployed in the US, and this is expected to grow exponentially. DERs are sometimes ‘behind the meter,’ meaning that they are not reported by utilities as part of the total regional demand or generation; instead, they show up as load reduction. DER benefits include resilience (on site energy generation and storage), reduced need for new transmission infrastructure, and lowering the total cost of the electricity system by reducing peak loads, transmission infrastructure and total land area needed for renewable energy. Common Types: Rooftop solar, batteries, grid interactivity; energy efficiency can also be included.
- Dispatchable generation meets the remainder of the electricity load not supplied by other forms of generation. These power plants are ramped up and down to meet the hour-by-hour and, in some cases, the minute-by-minute load changes induced by grid demand. Load-following power plants adjust power generation as demand fluctuates each day, while peaking power (peaker) plants are only used at the very highest (peak) electricity demand, perhaps only for a few hours during a few weeks of the year, and are (other than hydro) the least efficient, most expensive, and highest pollution sources. Common Types: Natural Gas, Diesel (Hawaii and Alaska), and Hydro. Enhanced geothermal can also be dispatchable.
The New Electricity Grid
Over the last hundred years, the US has relied on baseload and dispatchable generation primarily, including hydro, nuclear, coal and more recently, natural gas. Storage has been in the form of chemical energy within fossil fuels, water behind a dam, and nuclear energy contained within atoms. Blackouts have historically been common occurrences, with 320 between 1984 and 2006 that affected more than 50,000 customers each. Grid management has relied on a small number of generating power plants serving a somewhat predictable load.
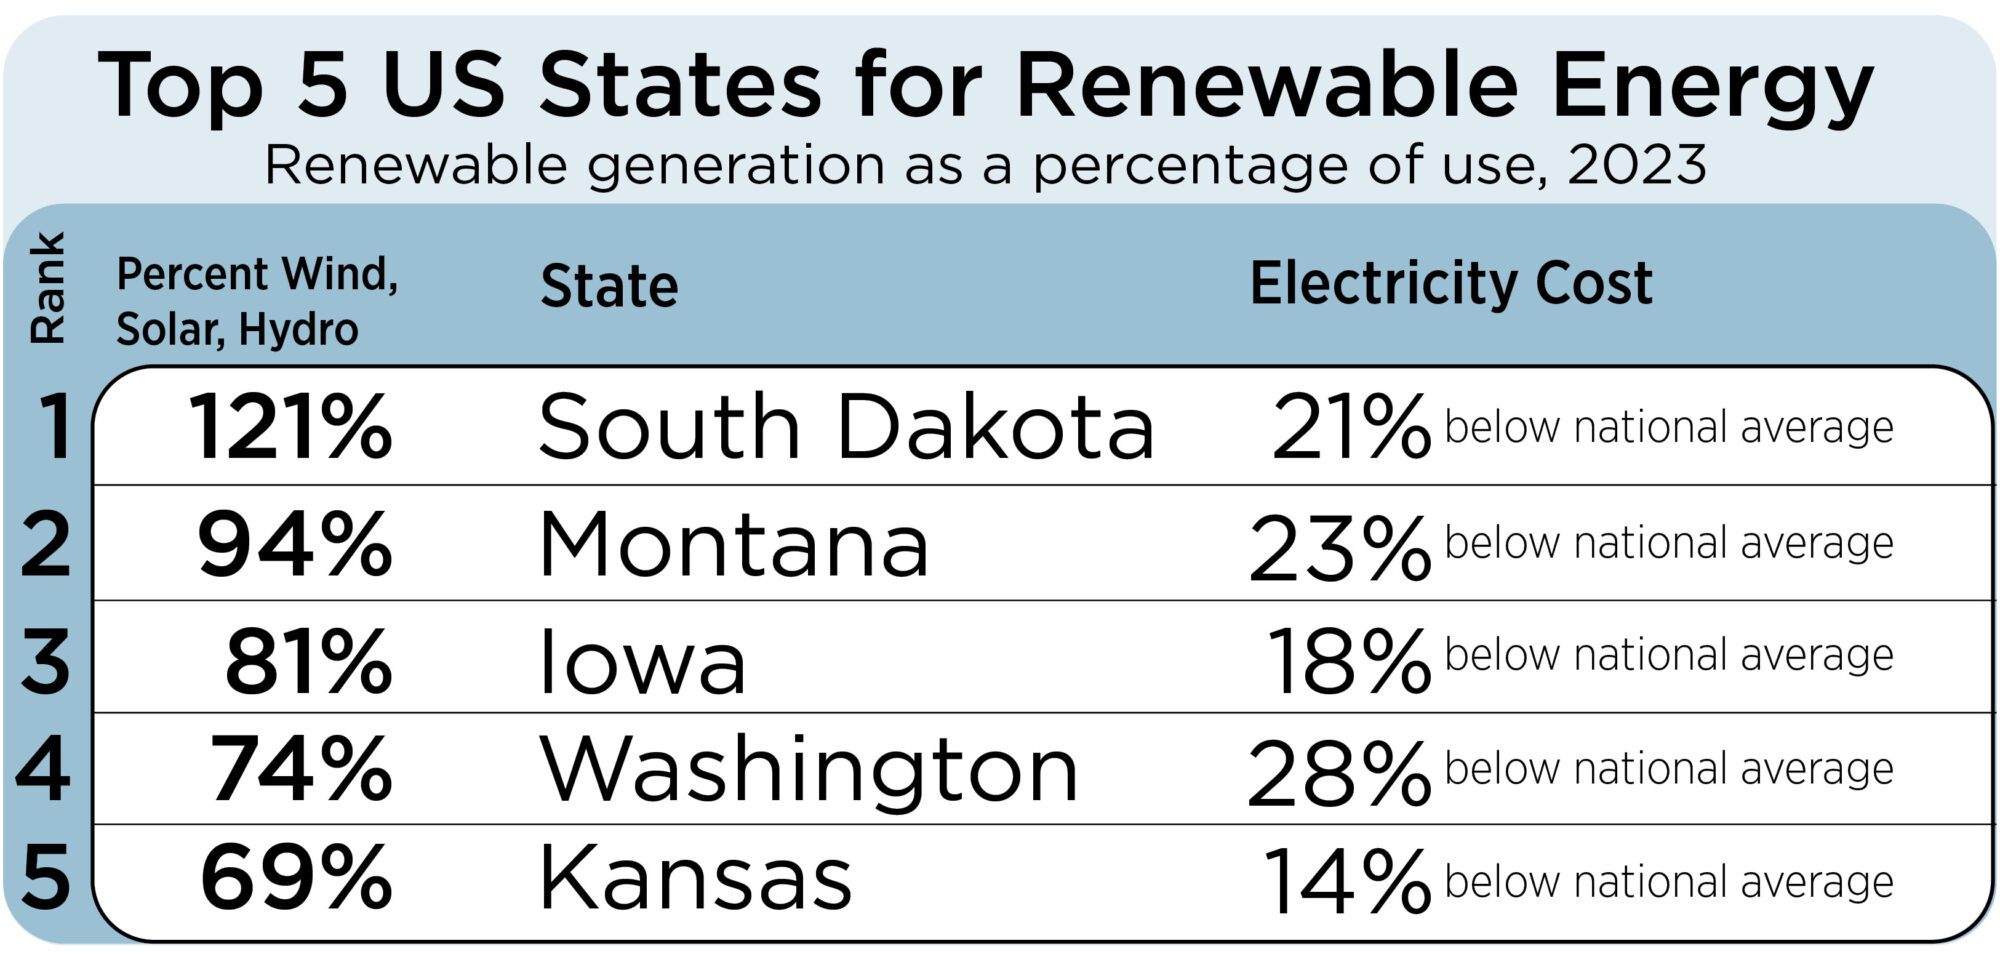
Solar and wind are the cheapest energy sources to operate since they require no fuel. The top 5 states in the US for renewable energy have electricity prices well below the national average.
The new grid, based on renewable energy as the cheapest form of electricity generation ever invented, primarily uses intermittent and distributed energy resources, as well as many forms of energy storage plus some dispatchable generation for low-generation times.
Management of the new grid is more complex and includes a larger number of generating plants and distributed energy resources, including millions of homes and businesses with rooftop solar, some with batteries and electric vehicles, and an emerging set of load-shifting appliances and building energy management strategies. Total electricity demand is increasing rapidly as well due to electric vehicles, data centers (including artificial Intelligence), electrification of buildings, and low carbon re-industrialization as manufacturing and jobs are brought back to the US.
The increases in total demand and the benefit of having access to intermittent solar and wind across large geographic areas mean that electricity transmission lines have become a critically important bottleneck to address. Even though the US used to build thousands of miles of new power lines each year to support the old grid, we have dramatically slowed transmission construction but will need to take it up again to support the new grid.
Distributed solar is one way to address this, since co-locating generation and use requires no transmission. In fact, all building-scale strategies can significantly reduce how much new generation and new transmission needs to be built. Seeing this, utilities are increasingly rewarding building-scale load-shifting as are some energy codes.
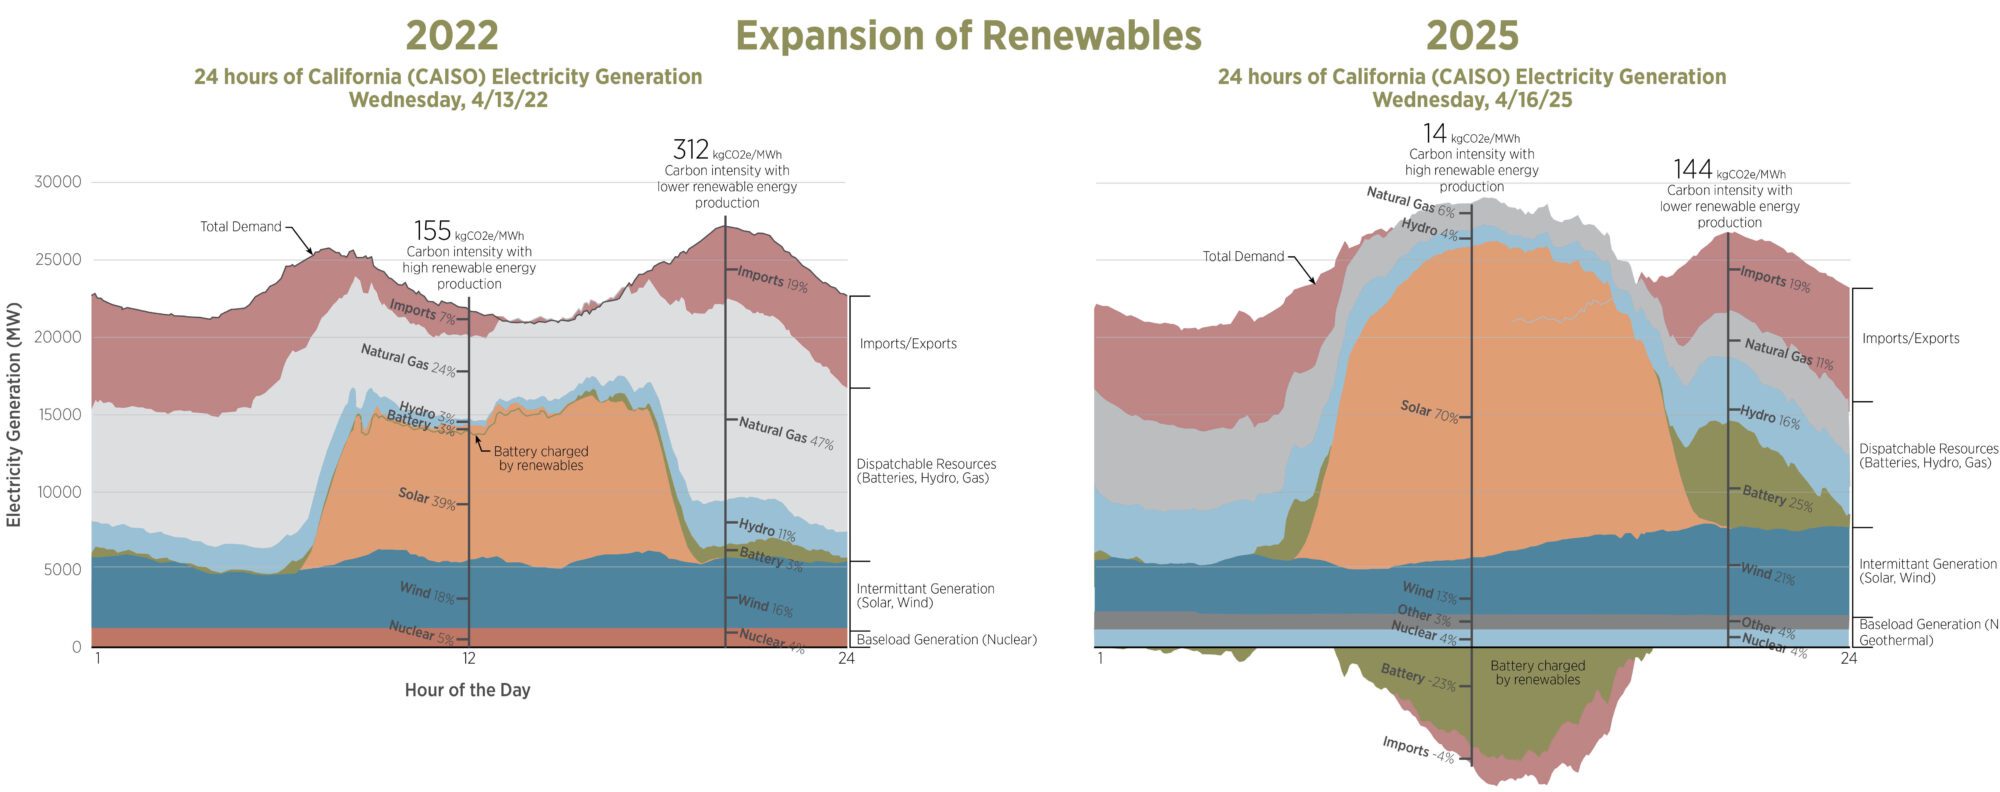
The California (CAISO) electricity grid is indicative of an increasingly solar and wind-heavy grid. With more renewables, the importance of passive design, energy efficiency, grid-interactive buildings, and batteries help manage the peaks, reducing the necessity for dispatchable fossil fuel generation. Note that rooftop solar and building-scale batteries influence this chart but are not directly shown since they operate behind electricity meters; the utility often sees them as efficiency, but not as generation or storage. Actual data for April 13, 2022 from CAISO and April 16, 202 (both are Wednesdays). Note that the high cost of electricity in California is not due to the abundance of renewable energy, but to a variety of other factors including wildfires and transmission upgrades.
Why pay for Fuel? Grid-Friendly Buildings
Since electricity demand fluctuates over time, we have currently overbuilt the number of power plants necessary for typical operation in order to meet peak demand. A US hourly peak of 720 GWh on Aug 12 2021 compares to the average hourly US demand of around 450 GWh. We have an average of 40% extra power generation capacity that is unused much of the time with the old grid, dominated by fossil fuels.
This extra capacity is turned off when it is not needed when it comes from fossil fuel fired plants since they pay for fuel. However, if the extra capacity is renewable energy, with no fuel costs, we essentially get free, extra energy when we are not meeting peak demand. This free, extra energy can be used to power EV charging, charge grid batteries, pump hydro uphill, or power building-scale systems that can be time-shifted to use energy during times of abundance.
Grid-friendly buildings are designed to use this cheap energy that is the outcome of the new, renewable electricity grid. Energy efficiency is the grid-friendliest; after that, strategies include time-shifting building loads and reducing peak loads. These strategies are having a huge impact on the cost of the energy transition since buildings use three-quarters of US electricity.
Grid-Interactive buildings can help in two ways:
- Consume electricity when renewables resources are generating. This is the most effective grid-interactive carbon reduction strategy, as it occurs daily. Architects should review the ‘load shapes’ (diagram below) for typical days to see where grid-interactive strategies can beneficially shift electricity demand.
- Move loads away from times when an entire region is at peak demand. These occur perhaps 80 hours a year (often hot summer afternoons and evenings as well as cold winter mornings) and require the construction of expensive peaker electricity plants or electricity storage, which both have high embodied carbon footprints.
The simplest strategies to make buildings grid-interactive, reducing carbon pollution:
- Fenestration optimization and shading to lower peak cooling and avoid times when the electricity grid has high carbon pollution. Minimizing west-facing windows or protecting them from solar gains during these times reduces building energy use, electricity demand, and sometimes mechanical equipment size and cost. The peak load shading may be very different than the shading that provides the best annual energy use reductions.
- Lighting reductions. During peak cooling times, lowering lighting by 10% ore more (often not noticeable) can reduce building cooling loads and overall electricity demand.
- Energy storage for water heaters. With large storage, hot water can be generated at times of day when renewables are generating low cost, nearly carbon free energy.
- Chilled water storage. Chilled water for space cooling or refrigeration can be generated at times of day when renewables are generating low cost, nearly carbon free energy.
- Smart EV charging. If electric vehicles (EVs) have charging flexibility, they can be scheduled for times when excess electricity is being generated on site, grid emission are lowest, or peak grid/draw is not occurring. Though not yet common in practice, EVs have the potential to also provide power to the building to further help control the load shape, perhaps by purchasing the energy from the EV owner.
- On-site energy generation and storage.
- Co-Generation shifts peaking generation from the utility to the customer. Most co-generation plants use fossil fuels, so while this is sometimes a cost win at the right scale, it will not trend towards carbon neutrality.
- Appliances that are programmed to operate when lots of renewable energy is being generated.
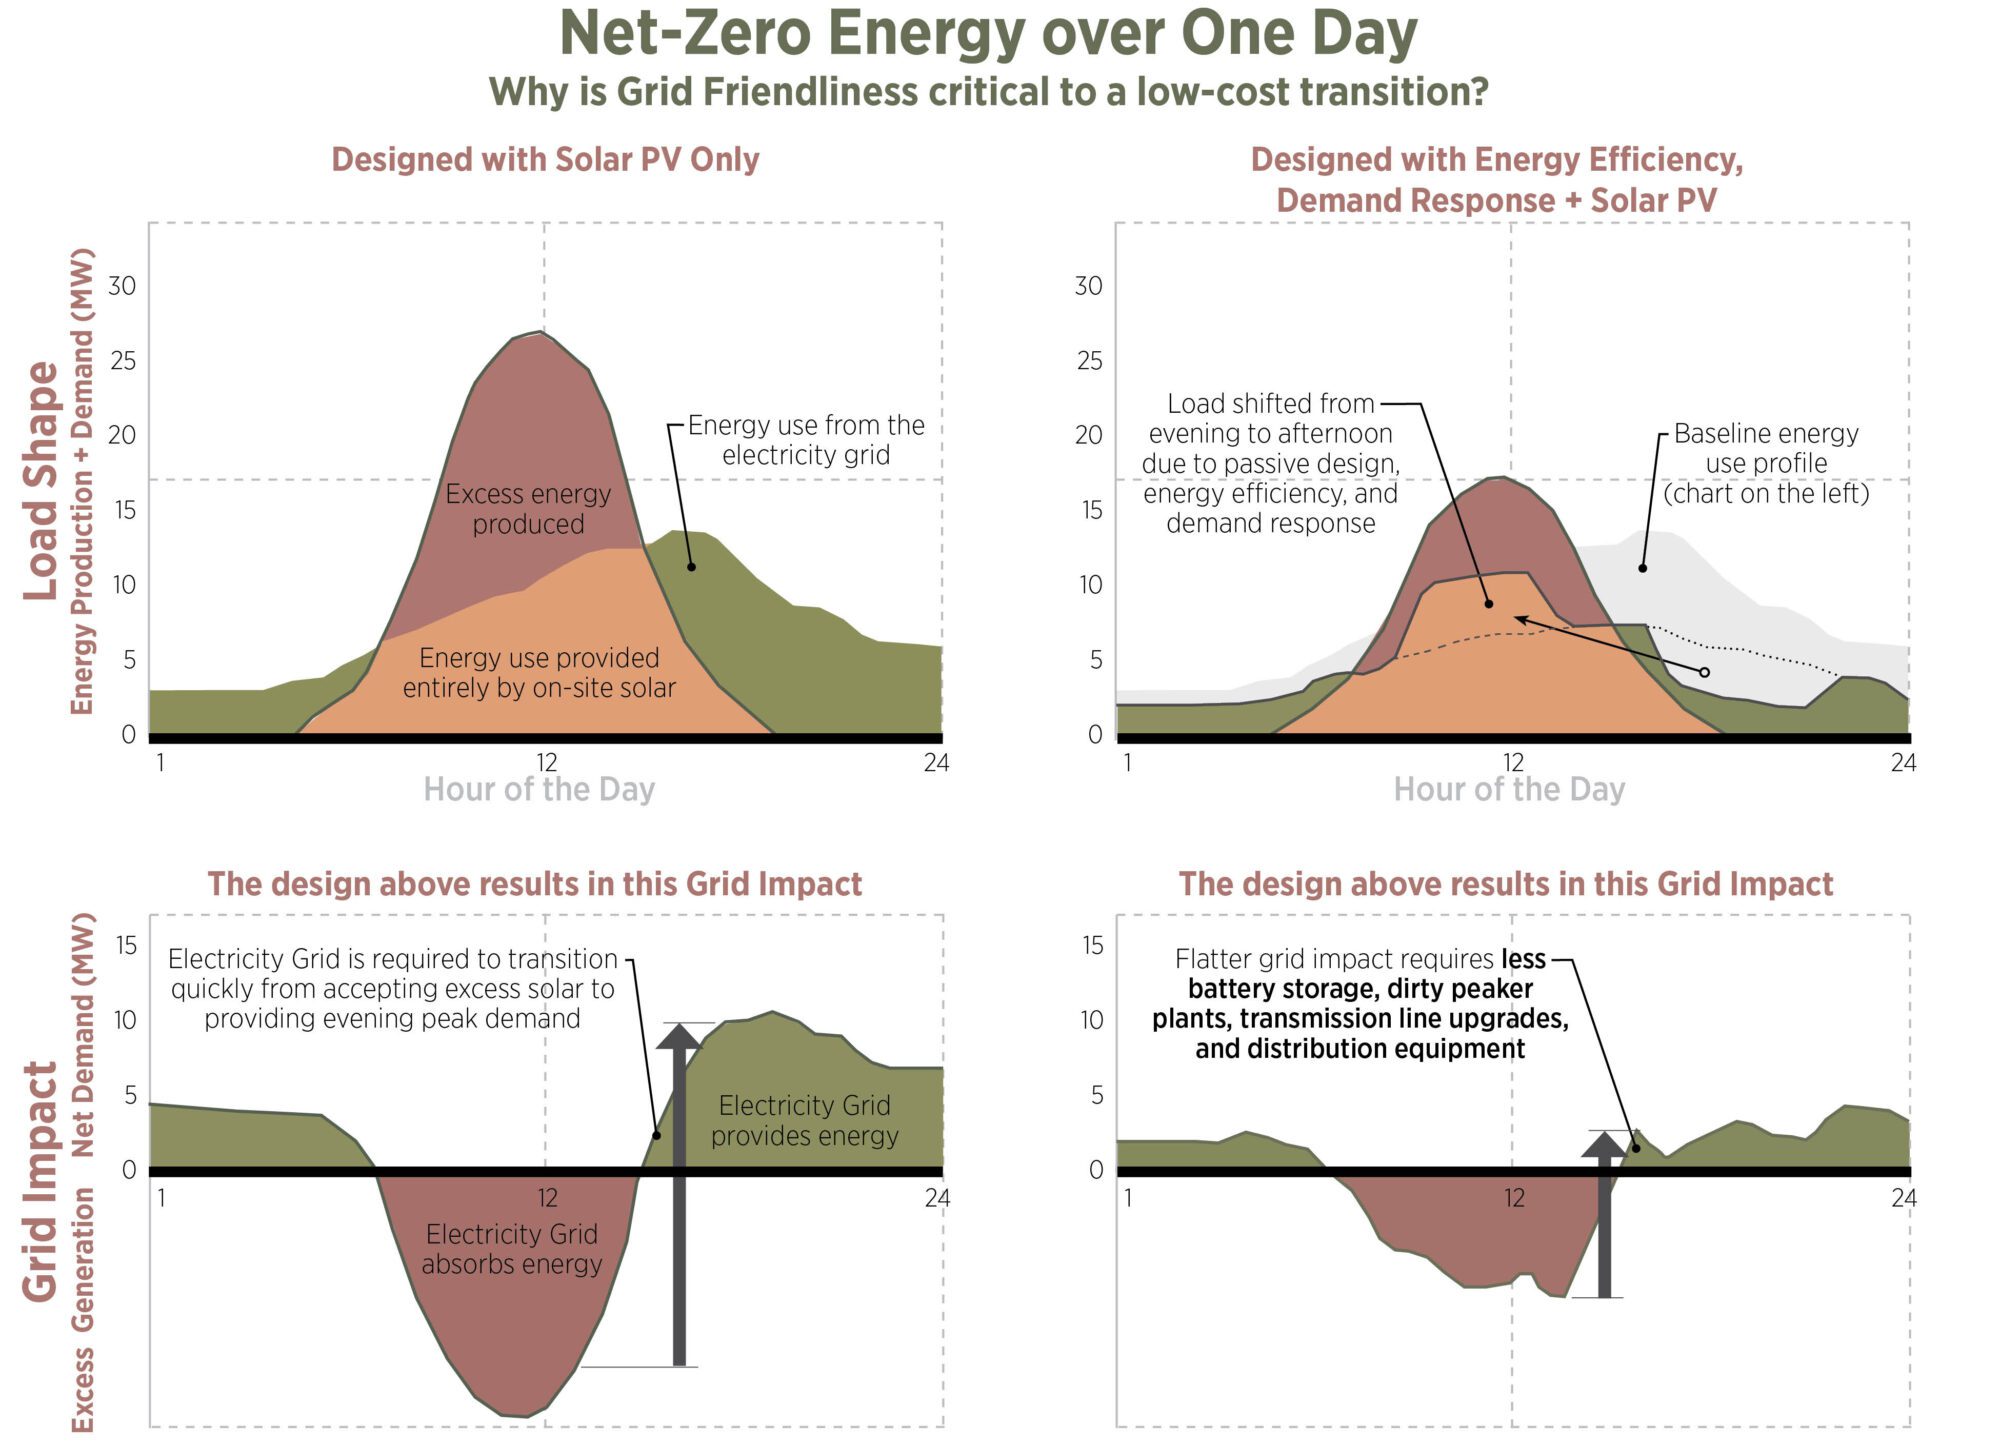
The upper left diagram shows a building’s electricity demand (load profile) and solar PV output over 24 hours; the lower left shows how the electricity grid needs to respond, providing power sometimes and then absorbing power during peak solar generation times. This demand profile is difficult and expensive for utilities to meet. On the right is a building load profile modified by energy efficiency and demand response (or load shifting). The bottom right shows a resulting load profile that is much easier and less expensive for the utility to meet since it involves less extreme peak demand and peak supply. Based on a diagram by the.
Operating cost are also driving grid-interactivity: building owners pay for electricity use and they often pay higher rates during times of peak electricity usage (peak rates); they also increasingly pay demand charges in some areas. Demand charges are based on a building’s peak electricity demand during the previous billing period – this fee helps the utility pay the cost to build and operate peaking generation plants that are infrequently used. Reducing the peak loads (and thus demand charges) aids utilities in building out the lowest cost electricity grid possible, with less storage and fewer peaker plants. The cost of building out the renewable energy electricity grid (including storage) – and thus the cost of electricity – will depend on how grid-interactive our buildings are.
Estimating Energy + Carbon Pollution
Our industry is very familiar with energy and modeling, but as we get closer to carbon neutrality we need to become conversant in carbon pollution modeling as well. Since electricity is trending near zero carbon by 2050 and building MEP systems (if not the equipment) tend to last for half a century or more, most of the lifetime of what we are designing today will use near-zero carbon electricity. Along that trajectory, there are important carbon tradeoffs that require modeling to estimate.
What data do we use to calculate carbon pollution from electricity? There are at least three sets, often expressed in kgCO2e/MWh:
- Average emissions include the average carbon intensity of all power produced or consumed in a region. This is appropriate for carbon accounting and general purposes.
- Short-run marginal emissions are an estimate of the carbon intensity of the electricity grid due to an immediate change in demand, such as turning off lighting or a chiller. The immediate change in demand requires turning up or down the dirtier dispatchable generation or the rapidly increasing supply of grid-scale batteries. Short run marginal emissions are often used for incentives.
- Long-run marginal emissions are similar to their short-run cousin, but they also consider how the specific action (installation of more efficient equipment due to standards or codes) may influence the operation and structure of the grid over time. This could be based on a policy or code that requires efficiency or grid-interactivity from a class of buildings. Since building-sector choices tend to be long-lived, long-run marginal emissions are more appropriate in decision-making.
Historically most architects have used average, annual carbon emissions (pollution) during design. The most common example is backward-looking regional e-grid emissions that tend to overestimate carbon pollution in our rapidly decarbonizing grid. Since pollution from electricity generation varies each hour, day, and season, using hourly data is more appropriate than using annual average data. Estimates using average annual emissions can be off by 35% or more compared to using hourly emissions; even worse, they don’t reward building-scale, grid-interactive strategies that reduce demand during the most challenging hours.
Since buildings operate for many decades, design teams should use forward-looking emissions that include recent and planned renewable energy and other grid changes. One example, NREL’s Cambium, contains forward-looking emissions based on the complex interaction of economics, state and federal laws, regional power trading, operational requirements of the grid, and more. Tips and tricks for using Cambium to forecast emissions on projects are part of Post 13. Since building systems (but not the equipment) last 50 years, using the projected carbon pollution intensity estimates for each year through 2050 can be used to understand the carbon value of energy reduction measures.
New and existing buildings can further reduce operational carbon through real-time grid-interactivity: WattTime provides 72 hour forecasts for the carbon intensity of local electricity so customers can time their energy use to lower carbon pollution. This means that internet-connected smart devices and building systems can automatically sync their energy usage with cleaner moments in the day. ElectricityMaps is also in this space.
Which hourly carbon pollution profile should be use? Since it is difficult to separate carbon pollution from grid electricity at a scale smaller than the region of the balancing authority or ISO, our recommendation is to use this scale. We also recommend using forward-looking, average hourly emissions for carbon estimates and forward-looking, hourly long-run marginal emissions for comparing two design options.
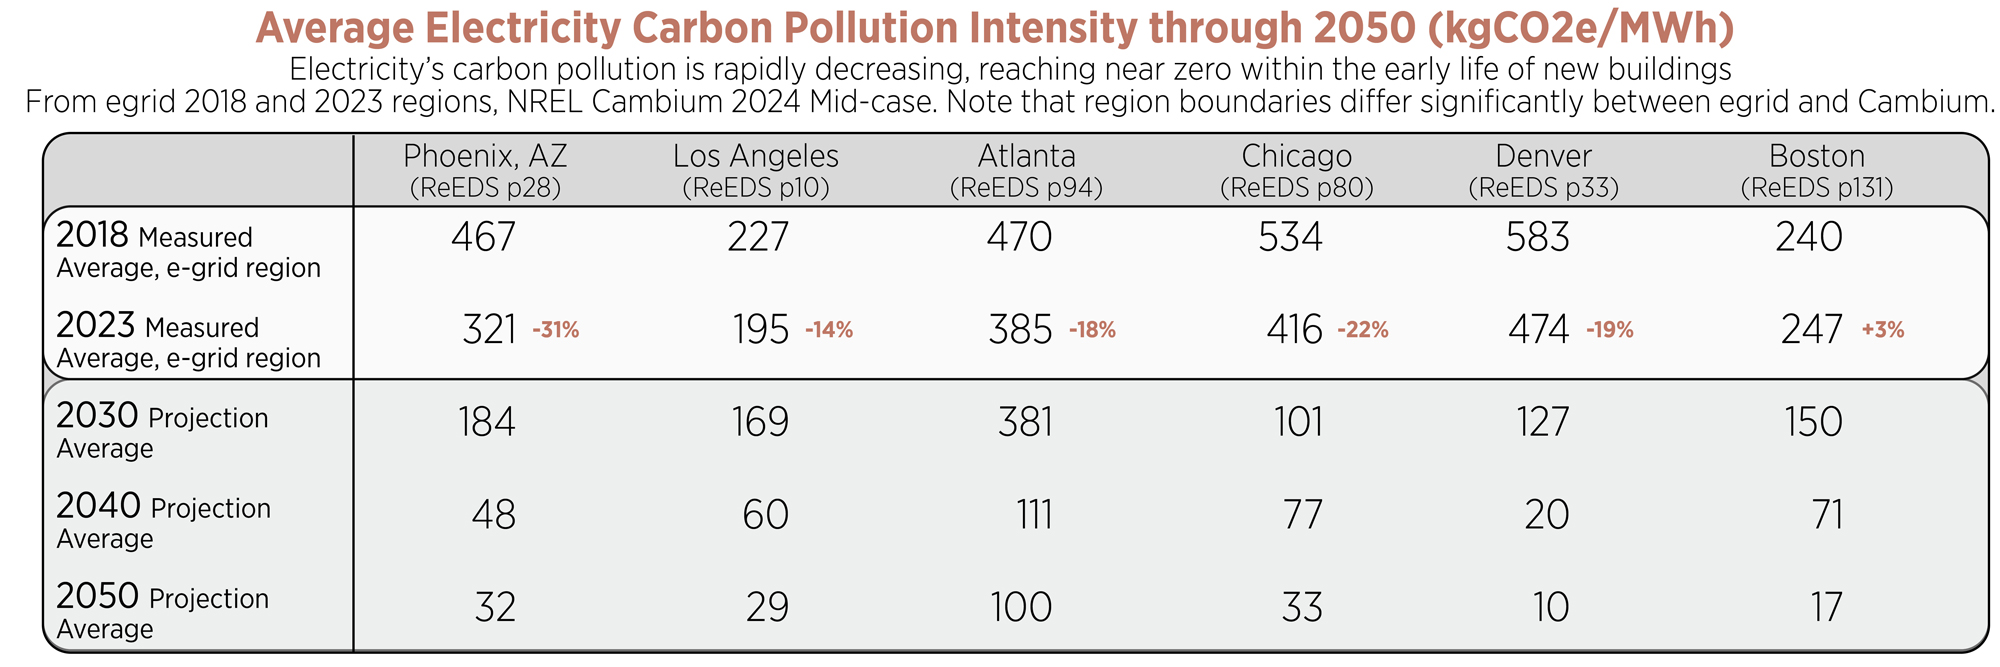
Electricity’s carbon pollution rapidly declined over the 5 years from 2018 to 2023, generally. E-grid data is backward-looking, however, and not suitable for buildings designed to last for many decades. Carbon pollution is projected to continue rapid reductions, reaching much closer to carbon neutrality early in the life of all buildings designed today.
Other Energy-related Pollution
A comprehensive accounting of a building’s energy-related carbon pollution should also include:
- Embodied carbon accounting for new (probably renewable) energy infrastructure to supply the building’s needs, even if energy is not built on site. While a rough estimate, some evidence suggests crystalline PV panels have an embodied carbon in the range of 15-45 kg CO2e/MWh. For a building with 30 EUI and embodied carbon of 50 kgCO2e/ft2, the embodied carbon of new PV panels to reach net zero energy adds around 10-20% to the embodied carbon total. Materials used to create PV panels are also recyclable, whereas combustion based power generation must continually be mined or drilled and refined.
- Total waste from renewables when they are decommissioned is much lower than other forms of power, and are expected to be a very small portion of total waste.
- Underreported fossil fuel pollution. Some emissions factors do not include pollution associated with methane leaks at wellheads and from pipelines, or the pollution from extraction, refinement, and transportation of fuels. This study looks at lifetime energy loss to these factors.
Some energy systems also use significant water resources and many water systems use significant energy resources, sometimes referred to as the Water-Energy Nexus. Around 40% of water use in the US is at power plants, and cooling towers in buildings also use a great deal of water. Water collection and treatment requires significant energy use as well. A thoughtful carbon analysis should include the pollution and ecological impact of attributional and consequential water use
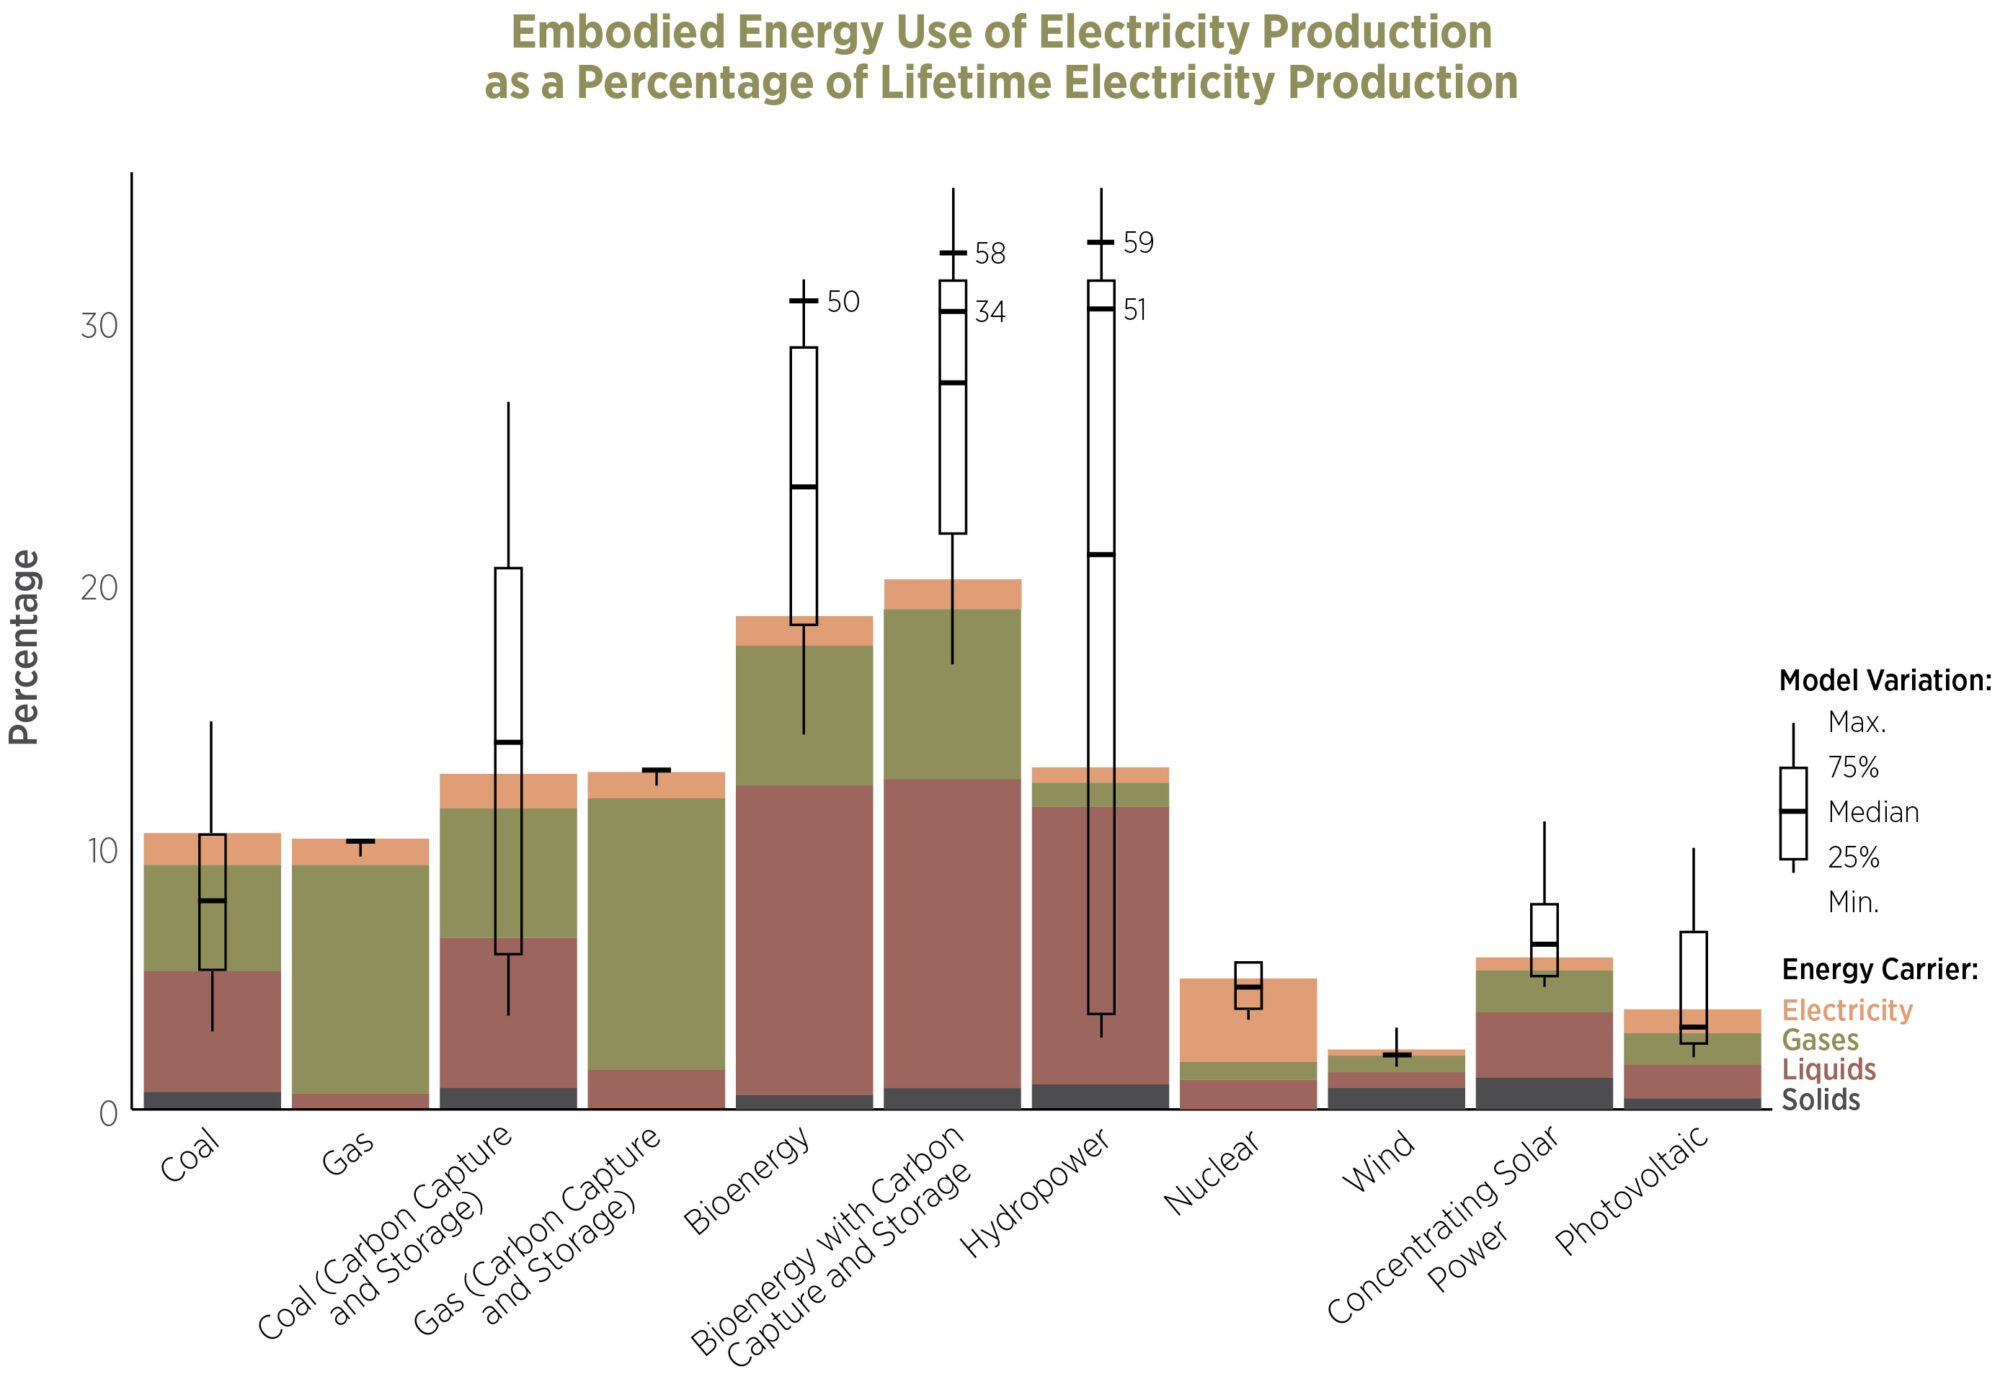
Carbon pollution from electricity generation typically ignores many factors, including the embodied carbon for the construction of the power plants and production and transportation of the fuels and other inputs. A study (Pehl et all, 2017) illustrates the embodied energy for these factors as a percentage of lifetime electricity production.
Conclusions and Recommendations
To reach zero carbon, buildings need to be all-electric, efficient, grid-interactive, and provide 100% renewable energy. Design teams should make decisions based on future hourly carbon projections through 2050, and use balancing authority-scale data, if possible, that includes pollution from electricity demand.
Post 13 details how to do this, including NREL’s Cambium viewer for forward-looking electricity data as well the LEED ACP excel file created by NBI for GridOptimal that estimates carbon emissions reductions due to grid-interactivity.
- All-electric, efficient buildings are going to get closer to zero carbon each year as the electricity grid rapidly adds renewables.
- Use forward-looking, hourly carbon emissions profiles for electricity production and consumption at the balancing authority (or state) Co-generation requires custom electricity factors as it produces both heat and electricity
- Consider strategies that use renewable energy when it is being generated (such as preheating, precooling, and thermal storage) and limit energy use when the grid has fewer renewables
- Account for the embodied carbon of new renewable energy to match consumption, even if not provided on site. Energy efficiency provides a large embodied carbon reduction, reduces land use for renewable energy, and is the primary operational carbon reduction strategy.
Please email any questions or comments to Kjell Anderson, kanderson@lmnarchitects.com
Thanks to our external collaborators and peer reviewers
Pieter Gagnon, NREL; Mark Frankel, Ecotope; Henry Richardson, WattTime; Jesse Walton, Mahlum Architects; Charles Eley, Architecture 2030
LMN Architects Team: Huma Timurbanga, Justin Schwartzhoff, Jenn Chen, Chris Savage, Andrew Gustin, Kjell Anderson
Posted: 10/20/2022
Edited: 09/25/2023
Edited: 09/12/2025
The text, images and graphics published here should be credited to LMN Architects unless stated otherwise. Permission to distribute, remix, adapt, and build upon the material in any medium or format for noncommercial purposes is granted as long as attribution is given to LMN Architects.